
Introduction
Arp’s equations are empirical (1944), but have been somewhat correlated to theory. According to Boulis et al [2009], exponential rate-decline case can be derived theoretically; for the case of constant compressibility liquid in a closed reservoir flowing at a constant wellbore flowing pressure during boundary-dominated flow conditions.
Rate Relations
|
|
Rate |
Cumulative Production |
|---|---|---|
|
Exponential (b=0) |
%5cright)%7d%5cend%7barray%7d%3c/title%3e %3cdefs aria-hidden='true'%3e %3cpath stroke-width='1' id='E1-MJMATHI-71' d='M33 157Q33 258 109 349T280 441Q340 441 372 389Q373 390 377 395T388 406T404 418Q438 442 450 442Q454 442 457 439T460 434Q460 425 391 149Q320 -135 320 -139Q320 -147 365 -148H390Q396 -156 396 -157T393 -175Q389 -188 383 -194H370Q339 -192 262 -192Q234 -192 211 -192T174 -192T157 -193Q143 -193 143 -185Q143 -182 145 -170Q149 -154 152 -151T172 -148Q220 -148 230 -141Q238 -136 258 -53T279 32Q279 33 272 29Q224 -10 172 -10Q117 -10 75 30T33 157ZM352 326Q329 405 277 405Q242 405 210 374T160 293Q131 214 119 129Q119 126 119 118T118 106Q118 61 136 44T179 26Q233 26 290 98L298 109L352 326Z'%3e%3c/path%3e %3cpath stroke-width='1' id='E1-MJMAIN-3D' d='M56 347Q56 360 70 367H707Q722 359 722 347Q722 336 708 328L390 327H72Q56 332 56 347ZM56 153Q56 168 72 173H708Q722 163 722 153Q722 140 707 133H70Q56 140 56 153Z'%3e%3c/path%3e %3cpath stroke-width='1' id='E1-MJMATHI-69' d='M184 600Q184 624 203 642T247 661Q265 661 277 649T290 619Q290 596 270 577T226 557Q211 557 198 567T184 600ZM21 287Q21 295 30 318T54 369T98 420T158 442Q197 442 223 419T250 357Q250 340 236 301T196 196T154 83Q149 61 149 51Q149 26 166 26Q175 26 185 29T208 43T235 78T260 137Q263 149 265 151T282 153Q302 153 302 143Q302 135 293 112T268 61T223 11T161 -11Q129 -11 102 10T74 74Q74 91 79 106T122 220Q160 321 166 341T173 380Q173 404 156 404H154Q124 404 99 371T61 287Q60 286 59 284T58 281T56 279T53 278T49 278T41 278H27Q21 284 21 287Z'%3e%3c/path%3e %3cpath stroke-width='1' id='E1-MJMAIN-65' d='M28 218Q28 273 48 318T98 391T163 433T229 448Q282 448 320 430T378 380T406 316T415 245Q415 238 408 231H126V216Q126 68 226 36Q246 30 270 30Q312 30 342 62Q359 79 369 104L379 128Q382 131 395 131H398Q415 131 415 121Q415 117 412 108Q393 53 349 21T250 -11Q155 -11 92 58T28 218ZM333 275Q322 403 238 411H236Q228 411 220 410T195 402T166 381T143 340T127 274V267H333V275Z'%3e%3c/path%3e %3cpath stroke-width='1' id='E1-MJMAIN-78' d='M201 0Q189 3 102 3Q26 3 17 0H11V46H25Q48 47 67 52T96 61T121 78T139 96T160 122T180 150L226 210L168 288Q159 301 149 315T133 336T122 351T113 363T107 370T100 376T94 379T88 381T80 383Q74 383 44 385H16V431H23Q59 429 126 429Q219 429 229 431H237V385Q201 381 201 369Q201 367 211 353T239 315T268 274L272 270L297 304Q329 345 329 358Q329 364 327 369T322 376T317 380T310 384L307 385H302V431H309Q324 428 408 428Q487 428 493 431H499V385H492Q443 385 411 368Q394 360 377 341T312 257L296 236L358 151Q424 61 429 57T446 50Q464 46 499 46H516V0H510H502Q494 1 482 1T457 2T432 2T414 3Q403 3 377 3T327 1L304 0H295V46H298Q309 46 320 51T331 63Q331 65 291 120L250 175Q249 174 219 133T185 88Q181 83 181 74Q181 63 188 55T206 46Q208 46 208 23V0H201Z'%3e%3c/path%3e %3cpath stroke-width='1' id='E1-MJMAIN-70' d='M36 -148H50Q89 -148 97 -134V-126Q97 -119 97 -107T97 -77T98 -38T98 6T98 55T98 106Q98 140 98 177T98 243T98 296T97 335T97 351Q94 370 83 376T38 385H20V408Q20 431 22 431L32 432Q42 433 61 434T98 436Q115 437 135 438T165 441T176 442H179V416L180 390L188 397Q247 441 326 441Q407 441 464 377T522 216Q522 115 457 52T310 -11Q242 -11 190 33L182 40V-45V-101Q182 -128 184 -134T195 -145Q216 -148 244 -148H260V-194H252L228 -193Q205 -192 178 -192T140 -191Q37 -191 28 -194H20V-148H36ZM424 218Q424 292 390 347T305 402Q234 402 182 337V98Q222 26 294 26Q345 26 384 80T424 218Z'%3e%3c/path%3e %3cpath stroke-width='1' id='E1-MJMAIN-28' d='M94 250Q94 319 104 381T127 488T164 576T202 643T244 695T277 729T302 750H315H319Q333 750 333 741Q333 738 316 720T275 667T226 581T184 443T167 250T184 58T225 -81T274 -167T316 -220T333 -241Q333 -250 318 -250H315H302L274 -226Q180 -141 137 -14T94 250Z'%3e%3c/path%3e %3cpath stroke-width='1' id='E1-MJMATHI-64' d='M366 683Q367 683 438 688T511 694Q523 694 523 686Q523 679 450 384T375 83T374 68Q374 26 402 26Q411 27 422 35Q443 55 463 131Q469 151 473 152Q475 153 483 153H487H491Q506 153 506 145Q506 140 503 129Q490 79 473 48T445 8T417 -8Q409 -10 393 -10Q359 -10 336 5T306 36L300 51Q299 52 296 50Q294 48 292 46Q233 -10 172 -10Q117 -10 75 30T33 157Q33 205 53 255T101 341Q148 398 195 420T280 442Q336 442 364 400Q369 394 369 396Q370 400 396 505T424 616Q424 629 417 632T378 637H357Q351 643 351 645T353 664Q358 683 366 683ZM352 326Q329 405 277 405Q242 405 210 374T160 293Q131 214 119 129Q119 126 119 118T118 106Q118 61 136 44T179 26Q233 26 290 98L298 109L352 326Z'%3e%3c/path%3e %3cpath stroke-width='1' id='E1-MJMATHI-74' d='M26 385Q19 392 19 395Q19 399 22 411T27 425Q29 430 36 430T87 431H140L159 511Q162 522 166 540T173 566T179 586T187 603T197 615T211 624T229 626Q247 625 254 615T261 596Q261 589 252 549T232 470L222 433Q222 431 272 431H323Q330 424 330 420Q330 398 317 385H210L174 240Q135 80 135 68Q135 26 162 26Q197 26 230 60T283 144Q285 150 288 151T303 153H307Q322 153 322 145Q322 142 319 133Q314 117 301 95T267 48T216 6T155 -11Q125 -11 98 4T59 56Q57 64 57 83V101L92 241Q127 382 128 383Q128 385 77 385H26Z'%3e%3c/path%3e %3cpath stroke-width='1' id='E1-MJMAIN-2212' d='M84 237T84 250T98 270H679Q694 262 694 250T679 230H98Q84 237 84 250Z'%3e%3c/path%3e %3cpath stroke-width='1' id='E1-MJMAIN-29' d='M60 749L64 750Q69 750 74 750H86L114 726Q208 641 251 514T294 250Q294 182 284 119T261 12T224 -76T186 -143T145 -194T113 -227T90 -246Q87 -249 86 -250H74Q66 -250 63 -250T58 -247T55 -238Q56 -237 66 -225Q221 -64 221 250T66 725Q56 737 55 738Q55 746 60 749Z'%3e%3c/path%3e %3c/defs%3e %3cg stroke='currentColor' fill='currentColor' stroke-width='0' transform='matrix(1 0 0 -1 0 0)' aria-hidden='true'%3e %3cg transform='translate(167%2c0)'%3e %3cg transform='translate(-11%2c0)'%3e %3cuse xlink:href='%23E1-MJMATHI-71' x='0' y='0'%3e%3c/use%3e %3cuse xlink:href='%23E1-MJMAIN-3D' x='738' y='0'%3e%3c/use%3e %3cg transform='translate(1516%2c0)'%3e %3cg transform='translate(397%2c0)'%3e %3crect stroke='none' width='6362' height='60' x='0' y='220'%3e%3c/rect%3e %3cg transform='translate(2785%2c819)'%3e %3cg%3e%3c/g%3e %3cuse xlink:href='%23E1-MJMATHI-71' x='0' y='0'%3e%3c/use%3e %3cuse transform='scale(0.707)' xlink:href='%23E1-MJMATHI-69' x='631' y='-213'%3e%3c/use%3e %3c/g%3e %3cg transform='translate(60%2c-880)'%3e %3cg%3e%3c/g%3e %3cuse xlink:href='%23E1-MJMAIN-65'%3e%3c/use%3e %3cuse xlink:href='%23E1-MJMAIN-78' x='444' y='0'%3e%3c/use%3e %3cuse xlink:href='%23E1-MJMAIN-70' x='973' y='0'%3e%3c/use%3e %3cg transform='translate(1529%2c0)'%3e %3cuse xlink:href='%23E1-MJMAIN-28' x='0' y='0'%3e%3c/use%3e %3cg transform='translate(389%2c0)'%3e %3cuse xlink:href='%23E1-MJMATHI-64' x='0' y='0'%3e%3c/use%3e %3cuse transform='scale(0.707)' xlink:href='%23E1-MJMATHI-69' x='736' y='-213'%3e%3c/use%3e %3c/g%3e %3cuse xlink:href='%23E1-MJMAIN-28' x='1254' y='0'%3e%3c/use%3e %3cuse xlink:href='%23E1-MJMATHI-74' x='1643' y='0'%3e%3c/use%3e %3cuse xlink:href='%23E1-MJMAIN-2212' x='2227' y='0'%3e%3c/use%3e %3cg transform='translate(3228%2c0)'%3e %3cuse xlink:href='%23E1-MJMATHI-74' x='0' y='0'%3e%3c/use%3e %3cuse transform='scale(0.707)' xlink:href='%23E1-MJMATHI-69' x='511' y='-213'%3e%3c/use%3e %3c/g%3e %3cuse xlink:href='%23E1-MJMAIN-29' x='3934' y='0'%3e%3c/use%3e %3cuse xlink:href='%23E1-MJMAIN-29' x='4323' y='0'%3e%3c/use%3e %3c/g%3e %3c/g%3e %3c/g%3e %3c/g%3e %3c/g%3e %3c/g%3e %3c/g%3e %3c/svg%3e)
|
' aria-hidden='true'%3e %3cg transform='translate(167%2c0)'%3e %3cg transform='translate(-11%2c0)'%3e %3cuse xlink:href='%23E1-MJMATHI-51' x='0' y='0'%3e%3c/use%3e %3cuse xlink:href='%23E1-MJMAIN-3D' x='1069' y='0'%3e%3c/use%3e %3cg transform='translate(1847%2c0)'%3e %3cg transform='translate(397%2c0)'%3e %3crect stroke='none' width='2594' height='60' x='0' y='220'%3e%3c/rect%3e %3cg transform='translate(60%2c819)'%3e %3cg%3e%3c/g%3e %3cuse xlink:href='%23E1-MJMATHI-71' x='0' y='0'%3e%3c/use%3e %3cuse transform='scale(0.707)' xlink:href='%23E1-MJMATHI-69' x='631' y='-213'%3e%3c/use%3e %3cuse xlink:href='%23E1-MJMAIN-2212' x='1013' y='0'%3e%3c/use%3e %3cuse xlink:href='%23E1-MJMATHI-71' x='2013' y='0'%3e%3c/use%3e %3c/g%3e %3cg transform='translate(864%2c-880)'%3e %3cg%3e%3c/g%3e %3cuse xlink:href='%23E1-MJMATHI-64' x='0' y='0'%3e%3c/use%3e %3cuse transform='scale(0.707)' xlink:href='%23E1-MJMATHI-69' x='736' y='-213'%3e%3c/use%3e %3c/g%3e %3c/g%3e %3c/g%3e %3c/g%3e %3c/g%3e %3c/g%3e %3c/svg%3e)
|
|
Hyperbolic: (0<b<1) |
%5cright)%5e%7b1/b%7d%7d%5cend%7barray%7d%3c/title%3e %3cdefs aria-hidden='true'%3e %3cpath stroke-width='1' id='E1-MJMATHI-71' d='M33 157Q33 258 109 349T280 441Q340 441 372 389Q373 390 377 395T388 406T404 418Q438 442 450 442Q454 442 457 439T460 434Q460 425 391 149Q320 -135 320 -139Q320 -147 365 -148H390Q396 -156 396 -157T393 -175Q389 -188 383 -194H370Q339 -192 262 -192Q234 -192 211 -192T174 -192T157 -193Q143 -193 143 -185Q143 -182 145 -170Q149 -154 152 -151T172 -148Q220 -148 230 -141Q238 -136 258 -53T279 32Q279 33 272 29Q224 -10 172 -10Q117 -10 75 30T33 157ZM352 326Q329 405 277 405Q242 405 210 374T160 293Q131 214 119 129Q119 126 119 118T118 106Q118 61 136 44T179 26Q233 26 290 98L298 109L352 326Z'%3e%3c/path%3e %3cpath stroke-width='1' id='E1-MJMAIN-3D' d='M56 347Q56 360 70 367H707Q722 359 722 347Q722 336 708 328L390 327H72Q56 332 56 347ZM56 153Q56 168 72 173H708Q722 163 722 153Q722 140 707 133H70Q56 140 56 153Z'%3e%3c/path%3e %3cpath stroke-width='1' id='E1-MJMATHI-69' d='M184 600Q184 624 203 642T247 661Q265 661 277 649T290 619Q290 596 270 577T226 557Q211 557 198 567T184 600ZM21 287Q21 295 30 318T54 369T98 420T158 442Q197 442 223 419T250 357Q250 340 236 301T196 196T154 83Q149 61 149 51Q149 26 166 26Q175 26 185 29T208 43T235 78T260 137Q263 149 265 151T282 153Q302 153 302 143Q302 135 293 112T268 61T223 11T161 -11Q129 -11 102 10T74 74Q74 91 79 106T122 220Q160 321 166 341T173 380Q173 404 156 404H154Q124 404 99 371T61 287Q60 286 59 284T58 281T56 279T53 278T49 278T41 278H27Q21 284 21 287Z'%3e%3c/path%3e %3cpath stroke-width='1' id='E1-MJMAIN-28' d='M94 250Q94 319 104 381T127 488T164 576T202 643T244 695T277 729T302 750H315H319Q333 750 333 741Q333 738 316 720T275 667T226 581T184 443T167 250T184 58T225 -81T274 -167T316 -220T333 -241Q333 -250 318 -250H315H302L274 -226Q180 -141 137 -14T94 250Z'%3e%3c/path%3e %3cpath stroke-width='1' id='E1-MJMAIN-31' d='M213 578L200 573Q186 568 160 563T102 556H83V602H102Q149 604 189 617T245 641T273 663Q275 666 285 666Q294 666 302 660V361L303 61Q310 54 315 52T339 48T401 46H427V0H416Q395 3 257 3Q121 3 100 0H88V46H114Q136 46 152 46T177 47T193 50T201 52T207 57T213 61V578Z'%3e%3c/path%3e %3cpath stroke-width='1' id='E1-MJMAIN-2B' d='M56 237T56 250T70 270H369V420L370 570Q380 583 389 583Q402 583 409 568V270H707Q722 262 722 250T707 230H409V-68Q401 -82 391 -82H389H387Q375 -82 369 -68V230H70Q56 237 56 250Z'%3e%3c/path%3e %3cpath stroke-width='1' id='E1-MJMATHI-62' d='M73 647Q73 657 77 670T89 683Q90 683 161 688T234 694Q246 694 246 685T212 542Q204 508 195 472T180 418L176 399Q176 396 182 402Q231 442 283 442Q345 442 383 396T422 280Q422 169 343 79T173 -11Q123 -11 82 27T40 150V159Q40 180 48 217T97 414Q147 611 147 623T109 637Q104 637 101 637H96Q86 637 83 637T76 640T73 647ZM336 325V331Q336 405 275 405Q258 405 240 397T207 376T181 352T163 330L157 322L136 236Q114 150 114 114Q114 66 138 42Q154 26 178 26Q211 26 245 58Q270 81 285 114T318 219Q336 291 336 325Z'%3e%3c/path%3e %3cpath stroke-width='1' id='E1-MJMATHI-64' d='M366 683Q367 683 438 688T511 694Q523 694 523 686Q523 679 450 384T375 83T374 68Q374 26 402 26Q411 27 422 35Q443 55 463 131Q469 151 473 152Q475 153 483 153H487H491Q506 153 506 145Q506 140 503 129Q490 79 473 48T445 8T417 -8Q409 -10 393 -10Q359 -10 336 5T306 36L300 51Q299 52 296 50Q294 48 292 46Q233 -10 172 -10Q117 -10 75 30T33 157Q33 205 53 255T101 341Q148 398 195 420T280 442Q336 442 364 400Q369 394 369 396Q370 400 396 505T424 616Q424 629 417 632T378 637H357Q351 643 351 645T353 664Q358 683 366 683ZM352 326Q329 405 277 405Q242 405 210 374T160 293Q131 214 119 129Q119 126 119 118T118 106Q118 61 136 44T179 26Q233 26 290 98L298 109L352 326Z'%3e%3c/path%3e %3cpath stroke-width='1' id='E1-MJMATHI-74' d='M26 385Q19 392 19 395Q19 399 22 411T27 425Q29 430 36 430T87 431H140L159 511Q162 522 166 540T173 566T179 586T187 603T197 615T211 624T229 626Q247 625 254 615T261 596Q261 589 252 549T232 470L222 433Q222 431 272 431H323Q330 424 330 420Q330 398 317 385H210L174 240Q135 80 135 68Q135 26 162 26Q197 26 230 60T283 144Q285 150 288 151T303 153H307Q322 153 322 145Q322 142 319 133Q314 117 301 95T267 48T216 6T155 -11Q125 -11 98 4T59 56Q57 64 57 83V101L92 241Q127 382 128 383Q128 385 77 385H26Z'%3e%3c/path%3e %3cpath stroke-width='1' id='E1-MJMAIN-2212' d='M84 237T84 250T98 270H679Q694 262 694 250T679 230H98Q84 237 84 250Z'%3e%3c/path%3e %3cpath stroke-width='1' id='E1-MJMAIN-29' d='M60 749L64 750Q69 750 74 750H86L114 726Q208 641 251 514T294 250Q294 182 284 119T261 12T224 -76T186 -143T145 -194T113 -227T90 -246Q87 -249 86 -250H74Q66 -250 63 -250T58 -247T55 -238Q56 -237 66 -225Q221 -64 221 250T66 725Q56 737 55 738Q55 746 60 749Z'%3e%3c/path%3e %3cpath stroke-width='1' id='E1-MJMAIN-2F' d='M423 750Q432 750 438 744T444 730Q444 725 271 248T92 -240Q85 -250 75 -250Q68 -250 62 -245T56 -231Q56 -221 230 257T407 740Q411 750 423 750Z'%3e%3c/path%3e %3c/defs%3e %3cg stroke='currentColor' fill='currentColor' stroke-width='0' transform='matrix(1 0 0 -1 0 0)' aria-hidden='true'%3e %3cg transform='translate(167%2c0)'%3e %3cg transform='translate(-11%2c0)'%3e %3cg transform='translate(0%2c74)'%3e %3cuse xlink:href='%23E1-MJMATHI-71' x='0' y='0'%3e%3c/use%3e %3cuse xlink:href='%23E1-MJMAIN-3D' x='738' y='0'%3e%3c/use%3e %3cg transform='translate(1516%2c0)'%3e %3cg transform='translate(397%2c0)'%3e %3crect stroke='none' width='8098' height='60' x='0' y='220'%3e%3c/rect%3e %3cg transform='translate(3653%2c819)'%3e %3cg%3e%3c/g%3e %3cuse xlink:href='%23E1-MJMATHI-71' x='0' y='0'%3e%3c/use%3e %3cuse transform='scale(0.707)' xlink:href='%23E1-MJMATHI-69' x='631' y='-213'%3e%3c/use%3e %3c/g%3e %3cg transform='translate(60%2c-1029)'%3e %3cg%3e%3c/g%3e %3cuse xlink:href='%23E1-MJMAIN-28' x='0' y='0'%3e%3c/use%3e %3cuse xlink:href='%23E1-MJMAIN-31' x='389' y='0'%3e%3c/use%3e %3cuse xlink:href='%23E1-MJMAIN-2B' x='1112' y='0'%3e%3c/use%3e %3cuse xlink:href='%23E1-MJMATHI-62' x='2112' y='0'%3e%3c/use%3e %3cg transform='translate(2542%2c0)'%3e %3cuse xlink:href='%23E1-MJMATHI-64' x='0' y='0'%3e%3c/use%3e %3cuse transform='scale(0.707)' xlink:href='%23E1-MJMATHI-69' x='736' y='-213'%3e%3c/use%3e %3c/g%3e %3cuse xlink:href='%23E1-MJMAIN-28' x='3407' y='0'%3e%3c/use%3e %3cuse xlink:href='%23E1-MJMATHI-74' x='3796' y='0'%3e%3c/use%3e %3cuse xlink:href='%23E1-MJMAIN-2212' x='4380' y='0'%3e%3c/use%3e %3cuse xlink:href='%23E1-MJMATHI-74' x='5381' y='0'%3e%3c/use%3e %3cuse xlink:href='%23E1-MJMATHI-69' x='5742' y='0'%3e%3c/use%3e %3cuse xlink:href='%23E1-MJMAIN-29' x='6088' y='0'%3e%3c/use%3e %3cuse xlink:href='%23E1-MJMAIN-29' x='6477' y='0'%3e%3c/use%3e %3cg transform='translate(6867%2c477)'%3e %3cuse transform='scale(0.707)' xlink:href='%23E1-MJMAIN-31' x='0' y='0'%3e%3c/use%3e %3cuse transform='scale(0.707)' xlink:href='%23E1-MJMAIN-2F' x='500' y='0'%3e%3c/use%3e %3cuse transform='scale(0.707)' xlink:href='%23E1-MJMATHI-62' x='1001' y='0'%3e%3c/use%3e %3c/g%3e %3c/g%3e %3c/g%3e %3c/g%3e %3c/g%3e %3c/g%3e %3c/g%3e %3c/g%3e %3c/svg%3e)
|
d_i%7d%5cright)%5cleft(q%5e%7b1-b%7d-q%5e%7b1-b%7d_i%5cright)%5cend%7barray%7d%3c/title%3e %3cdefs aria-hidden='true'%3e %3cpath stroke-width='1' id='E1-MJMATHI-51' d='M399 -80Q399 -47 400 -30T402 -11V-7L387 -11Q341 -22 303 -22Q208 -22 138 35T51 201Q50 209 50 244Q50 346 98 438T227 601Q351 704 476 704Q514 704 524 703Q621 689 680 617T740 435Q740 255 592 107Q529 47 461 16L444 8V3Q444 2 449 -24T470 -66T516 -82Q551 -82 583 -60T625 -3Q631 11 638 11Q647 11 649 2Q649 -6 639 -34T611 -100T557 -165T481 -194Q399 -194 399 -87V-80ZM636 468Q636 523 621 564T580 625T530 655T477 665Q429 665 379 640Q277 591 215 464T153 216Q153 110 207 59Q231 38 236 38V46Q236 86 269 120T347 155Q372 155 390 144T417 114T429 82T435 55L448 64Q512 108 557 185T619 334T636 468ZM314 18Q362 18 404 39L403 49Q399 104 366 115Q354 117 347 117Q344 117 341 117T337 118Q317 118 296 98T274 52Q274 18 314 18Z'%3e%3c/path%3e %3cpath stroke-width='1' id='E1-MJMAIN-3D' d='M56 347Q56 360 70 367H707Q722 359 722 347Q722 336 708 328L390 327H72Q56 332 56 347ZM56 153Q56 168 72 173H708Q722 163 722 153Q722 140 707 133H70Q56 140 56 153Z'%3e%3c/path%3e %3cpath stroke-width='1' id='E1-MJMAIN-28' d='M94 250Q94 319 104 381T127 488T164 576T202 643T244 695T277 729T302 750H315H319Q333 750 333 741Q333 738 316 720T275 667T226 581T184 443T167 250T184 58T225 -81T274 -167T316 -220T333 -241Q333 -250 318 -250H315H302L274 -226Q180 -141 137 -14T94 250Z'%3e%3c/path%3e %3cpath stroke-width='1' id='E1-MJMATHI-71' d='M33 157Q33 258 109 349T280 441Q340 441 372 389Q373 390 377 395T388 406T404 418Q438 442 450 442Q454 442 457 439T460 434Q460 425 391 149Q320 -135 320 -139Q320 -147 365 -148H390Q396 -156 396 -157T393 -175Q389 -188 383 -194H370Q339 -192 262 -192Q234 -192 211 -192T174 -192T157 -193Q143 -193 143 -185Q143 -182 145 -170Q149 -154 152 -151T172 -148Q220 -148 230 -141Q238 -136 258 -53T279 32Q279 33 272 29Q224 -10 172 -10Q117 -10 75 30T33 157ZM352 326Q329 405 277 405Q242 405 210 374T160 293Q131 214 119 129Q119 126 119 118T118 106Q118 61 136 44T179 26Q233 26 290 98L298 109L352 326Z'%3e%3c/path%3e %3cpath stroke-width='1' id='E1-MJMATHI-62' d='M73 647Q73 657 77 670T89 683Q90 683 161 688T234 694Q246 694 246 685T212 542Q204 508 195 472T180 418L176 399Q176 396 182 402Q231 442 283 442Q345 442 383 396T422 280Q422 169 343 79T173 -11Q123 -11 82 27T40 150V159Q40 180 48 217T97 414Q147 611 147 623T109 637Q104 637 101 637H96Q86 637 83 637T76 640T73 647ZM336 325V331Q336 405 275 405Q258 405 240 397T207 376T181 352T163 330L157 322L136 236Q114 150 114 114Q114 66 138 42Q154 26 178 26Q211 26 245 58Q270 81 285 114T318 219Q336 291 336 325Z'%3e%3c/path%3e %3cpath stroke-width='1' id='E1-MJMATHI-69' d='M184 600Q184 624 203 642T247 661Q265 661 277 649T290 619Q290 596 270 577T226 557Q211 557 198 567T184 600ZM21 287Q21 295 30 318T54 369T98 420T158 442Q197 442 223 419T250 357Q250 340 236 301T196 196T154 83Q149 61 149 51Q149 26 166 26Q175 26 185 29T208 43T235 78T260 137Q263 149 265 151T282 153Q302 153 302 143Q302 135 293 112T268 61T223 11T161 -11Q129 -11 102 10T74 74Q74 91 79 106T122 220Q160 321 166 341T173 380Q173 404 156 404H154Q124 404 99 371T61 287Q60 286 59 284T58 281T56 279T53 278T49 278T41 278H27Q21 284 21 287Z'%3e%3c/path%3e %3cpath stroke-width='1' id='E1-MJMAIN-2212' d='M84 237T84 250T98 270H679Q694 262 694 250T679 230H98Q84 237 84 250Z'%3e%3c/path%3e %3cpath stroke-width='1' id='E1-MJMAIN-31' d='M213 578L200 573Q186 568 160 563T102 556H83V602H102Q149 604 189 617T245 641T273 663Q275 666 285 666Q294 666 302 660V361L303 61Q310 54 315 52T339 48T401 46H427V0H416Q395 3 257 3Q121 3 100 0H88V46H114Q136 46 152 46T177 47T193 50T201 52T207 57T213 61V578Z'%3e%3c/path%3e %3cpath stroke-width='1' id='E1-MJMAIN-29' d='M60 749L64 750Q69 750 74 750H86L114 726Q208 641 251 514T294 250Q294 182 284 119T261 12T224 -76T186 -143T145 -194T113 -227T90 -246Q87 -249 86 -250H74Q66 -250 63 -250T58 -247T55 -238Q56 -237 66 -225Q221 -64 221 250T66 725Q56 737 55 738Q55 746 60 749Z'%3e%3c/path%3e %3cpath stroke-width='1' id='E1-MJMATHI-64' d='M366 683Q367 683 438 688T511 694Q523 694 523 686Q523 679 450 384T375 83T374 68Q374 26 402 26Q411 27 422 35Q443 55 463 131Q469 151 473 152Q475 153 483 153H487H491Q506 153 506 145Q506 140 503 129Q490 79 473 48T445 8T417 -8Q409 -10 393 -10Q359 -10 336 5T306 36L300 51Q299 52 296 50Q294 48 292 46Q233 -10 172 -10Q117 -10 75 30T33 157Q33 205 53 255T101 341Q148 398 195 420T280 442Q336 442 364 400Q369 394 369 396Q370 400 396 505T424 616Q424 629 417 632T378 637H357Q351 643 351 645T353 664Q358 683 366 683ZM352 326Q329 405 277 405Q242 405 210 374T160 293Q131 214 119 129Q119 126 119 118T118 106Q118 61 136 44T179 26Q233 26 290 98L298 109L352 326Z'%3e%3c/path%3e %3cpath stroke-width='1' id='E1-MJSZ4-28' d='M758 -1237T758 -1240T752 -1249H736Q718 -1249 717 -1248Q711 -1245 672 -1199Q237 -706 237 251T672 1700Q697 1730 716 1749Q718 1750 735 1750H752Q758 1744 758 1741Q758 1737 740 1713T689 1644T619 1537T540 1380T463 1176Q348 802 348 251Q348 -242 441 -599T744 -1218Q758 -1237 758 -1240Z'%3e%3c/path%3e %3cpath stroke-width='1' id='E1-MJSZ4-29' d='M33 1741Q33 1750 51 1750H60H65Q73 1750 81 1743T119 1700Q554 1207 554 251Q554 -707 119 -1199Q76 -1250 66 -1250Q65 -1250 62 -1250T56 -1249Q55 -1249 53 -1249T49 -1250Q33 -1250 33 -1239Q33 -1236 50 -1214T98 -1150T163 -1052T238 -910T311 -727Q443 -335 443 251Q443 402 436 532T405 831T339 1142T224 1438T50 1716Q33 1737 33 1741Z'%3e%3c/path%3e %3cpath stroke-width='1' id='E1-MJSZ1-28' d='M152 251Q152 646 388 850H416Q422 844 422 841Q422 837 403 816T357 753T302 649T255 482T236 250Q236 124 255 19T301 -147T356 -251T403 -315T422 -340Q422 -343 416 -349H388Q359 -325 332 -296T271 -213T212 -97T170 56T152 251Z'%3e%3c/path%3e %3cpath stroke-width='1' id='E1-MJSZ1-29' d='M305 251Q305 -145 69 -349H56Q43 -349 39 -347T35 -338Q37 -333 60 -307T108 -239T160 -136T204 27T221 250T204 473T160 636T108 740T60 807T35 839Q35 850 50 850H56H69Q197 743 256 566Q305 425 305 251Z'%3e%3c/path%3e %3c/defs%3e %3cg stroke='currentColor' fill='currentColor' stroke-width='0' transform='matrix(1 0 0 -1 0 0)' aria-hidden='true'%3e %3cg transform='translate(167%2c0)'%3e %3cg transform='translate(-11%2c0)'%3e %3cuse xlink:href='%23E1-MJMATHI-51' x='0' y='0'%3e%3c/use%3e %3cuse xlink:href='%23E1-MJMAIN-3D' x='1069' y='0'%3e%3c/use%3e %3cg transform='translate(2125%2c0)'%3e %3cuse xlink:href='%23E1-MJSZ4-28'%3e%3c/use%3e %3cg transform='translate(792%2c0)'%3e %3cg transform='translate(120%2c0)'%3e %3crect stroke='none' width='3916' height='60' x='0' y='220'%3e%3c/rect%3e %3cg transform='translate(1524%2c831)'%3e %3cg%3e%3c/g%3e %3cuse xlink:href='%23E1-MJMATHI-71' x='0' y='0'%3e%3c/use%3e %3cuse transform='scale(0.707)' xlink:href='%23E1-MJMATHI-62' x='657' y='499'%3e%3c/use%3e %3cuse transform='scale(0.707)' xlink:href='%23E1-MJMATHI-69' x='631' y='-430'%3e%3c/use%3e %3c/g%3e %3cg transform='translate(60%2c-880)'%3e %3cg%3e%3c/g%3e %3cuse xlink:href='%23E1-MJMAIN-28' x='0' y='0'%3e%3c/use%3e %3cuse xlink:href='%23E1-MJMATHI-62' x='389' y='0'%3e%3c/use%3e %3cuse xlink:href='%23E1-MJMAIN-2212' x='1041' y='0'%3e%3c/use%3e %3cuse xlink:href='%23E1-MJMAIN-31' x='2041' y='0'%3e%3c/use%3e %3cuse xlink:href='%23E1-MJMAIN-29' x='2542' y='0'%3e%3c/use%3e %3cg transform='translate(2931%2c0)'%3e %3cuse xlink:href='%23E1-MJMATHI-64' x='0' y='0'%3e%3c/use%3e %3cuse transform='scale(0.707)' xlink:href='%23E1-MJMATHI-69' x='736' y='-213'%3e%3c/use%3e %3c/g%3e %3c/g%3e %3c/g%3e %3c/g%3e %3cuse xlink:href='%23E1-MJSZ4-29' x='4949' y='0'%3e%3c/use%3e %3c/g%3e %3cg transform='translate(8033%2c0)'%3e %3cuse xlink:href='%23E1-MJSZ1-28'%3e%3c/use%3e %3cg transform='translate(458%2c0)'%3e %3cuse xlink:href='%23E1-MJMATHI-71' x='0' y='0'%3e%3c/use%3e %3cg transform='translate(464%2c412)'%3e %3cuse transform='scale(0.707)' xlink:href='%23E1-MJMAIN-31' x='0' y='0'%3e%3c/use%3e %3cuse transform='scale(0.707)' xlink:href='%23E1-MJMAIN-2212' x='500' y='0'%3e%3c/use%3e %3cuse transform='scale(0.707)' xlink:href='%23E1-MJMATHI-62' x='1279' y='0'%3e%3c/use%3e %3c/g%3e %3c/g%3e %3cuse xlink:href='%23E1-MJMAIN-2212' x='2453' y='0'%3e%3c/use%3e %3cg transform='translate(3454%2c0)'%3e %3cuse xlink:href='%23E1-MJMATHI-71' x='0' y='0'%3e%3c/use%3e %3cg transform='translate(464%2c403)'%3e %3cuse transform='scale(0.707)' xlink:href='%23E1-MJMAIN-31' x='0' y='0'%3e%3c/use%3e %3cuse transform='scale(0.707)' xlink:href='%23E1-MJMAIN-2212' x='500' y='0'%3e%3c/use%3e %3cuse transform='scale(0.707)' xlink:href='%23E1-MJMATHI-62' x='1279' y='0'%3e%3c/use%3e %3c/g%3e %3cuse transform='scale(0.707)' xlink:href='%23E1-MJMATHI-69' x='631' y='-430'%3e%3c/use%3e %3c/g%3e %3cuse xlink:href='%23E1-MJSZ1-29' x='5227' y='-1'%3e%3c/use%3e %3c/g%3e %3c/g%3e %3c/g%3e %3c/g%3e %3c/svg%3e)
|
|
Harmonic: (b=1) |
%5cright)%7d%5cend%7barray%7d%3c/title%3e %3cdefs aria-hidden='true'%3e %3cpath stroke-width='1' id='E1-MJMATHI-71' d='M33 157Q33 258 109 349T280 441Q340 441 372 389Q373 390 377 395T388 406T404 418Q438 442 450 442Q454 442 457 439T460 434Q460 425 391 149Q320 -135 320 -139Q320 -147 365 -148H390Q396 -156 396 -157T393 -175Q389 -188 383 -194H370Q339 -192 262 -192Q234 -192 211 -192T174 -192T157 -193Q143 -193 143 -185Q143 -182 145 -170Q149 -154 152 -151T172 -148Q220 -148 230 -141Q238 -136 258 -53T279 32Q279 33 272 29Q224 -10 172 -10Q117 -10 75 30T33 157ZM352 326Q329 405 277 405Q242 405 210 374T160 293Q131 214 119 129Q119 126 119 118T118 106Q118 61 136 44T179 26Q233 26 290 98L298 109L352 326Z'%3e%3c/path%3e %3cpath stroke-width='1' id='E1-MJMAIN-3D' d='M56 347Q56 360 70 367H707Q722 359 722 347Q722 336 708 328L390 327H72Q56 332 56 347ZM56 153Q56 168 72 173H708Q722 163 722 153Q722 140 707 133H70Q56 140 56 153Z'%3e%3c/path%3e %3cpath stroke-width='1' id='E1-MJMATHI-69' d='M184 600Q184 624 203 642T247 661Q265 661 277 649T290 619Q290 596 270 577T226 557Q211 557 198 567T184 600ZM21 287Q21 295 30 318T54 369T98 420T158 442Q197 442 223 419T250 357Q250 340 236 301T196 196T154 83Q149 61 149 51Q149 26 166 26Q175 26 185 29T208 43T235 78T260 137Q263 149 265 151T282 153Q302 153 302 143Q302 135 293 112T268 61T223 11T161 -11Q129 -11 102 10T74 74Q74 91 79 106T122 220Q160 321 166 341T173 380Q173 404 156 404H154Q124 404 99 371T61 287Q60 286 59 284T58 281T56 279T53 278T49 278T41 278H27Q21 284 21 287Z'%3e%3c/path%3e %3cpath stroke-width='1' id='E1-MJMAIN-28' d='M94 250Q94 319 104 381T127 488T164 576T202 643T244 695T277 729T302 750H315H319Q333 750 333 741Q333 738 316 720T275 667T226 581T184 443T167 250T184 58T225 -81T274 -167T316 -220T333 -241Q333 -250 318 -250H315H302L274 -226Q180 -141 137 -14T94 250Z'%3e%3c/path%3e %3cpath stroke-width='1' id='E1-MJMAIN-31' d='M213 578L200 573Q186 568 160 563T102 556H83V602H102Q149 604 189 617T245 641T273 663Q275 666 285 666Q294 666 302 660V361L303 61Q310 54 315 52T339 48T401 46H427V0H416Q395 3 257 3Q121 3 100 0H88V46H114Q136 46 152 46T177 47T193 50T201 52T207 57T213 61V578Z'%3e%3c/path%3e %3cpath stroke-width='1' id='E1-MJMAIN-2B' d='M56 237T56 250T70 270H369V420L370 570Q380 583 389 583Q402 583 409 568V270H707Q722 262 722 250T707 230H409V-68Q401 -82 391 -82H389H387Q375 -82 369 -68V230H70Q56 237 56 250Z'%3e%3c/path%3e %3cpath stroke-width='1' id='E1-MJMATHI-64' d='M366 683Q367 683 438 688T511 694Q523 694 523 686Q523 679 450 384T375 83T374 68Q374 26 402 26Q411 27 422 35Q443 55 463 131Q469 151 473 152Q475 153 483 153H487H491Q506 153 506 145Q506 140 503 129Q490 79 473 48T445 8T417 -8Q409 -10 393 -10Q359 -10 336 5T306 36L300 51Q299 52 296 50Q294 48 292 46Q233 -10 172 -10Q117 -10 75 30T33 157Q33 205 53 255T101 341Q148 398 195 420T280 442Q336 442 364 400Q369 394 369 396Q370 400 396 505T424 616Q424 629 417 632T378 637H357Q351 643 351 645T353 664Q358 683 366 683ZM352 326Q329 405 277 405Q242 405 210 374T160 293Q131 214 119 129Q119 126 119 118T118 106Q118 61 136 44T179 26Q233 26 290 98L298 109L352 326Z'%3e%3c/path%3e %3cpath stroke-width='1' id='E1-MJMATHI-74' d='M26 385Q19 392 19 395Q19 399 22 411T27 425Q29 430 36 430T87 431H140L159 511Q162 522 166 540T173 566T179 586T187 603T197 615T211 624T229 626Q247 625 254 615T261 596Q261 589 252 549T232 470L222 433Q222 431 272 431H323Q330 424 330 420Q330 398 317 385H210L174 240Q135 80 135 68Q135 26 162 26Q197 26 230 60T283 144Q285 150 288 151T303 153H307Q322 153 322 145Q322 142 319 133Q314 117 301 95T267 48T216 6T155 -11Q125 -11 98 4T59 56Q57 64 57 83V101L92 241Q127 382 128 383Q128 385 77 385H26Z'%3e%3c/path%3e %3cpath stroke-width='1' id='E1-MJMAIN-2212' d='M84 237T84 250T98 270H679Q694 262 694 250T679 230H98Q84 237 84 250Z'%3e%3c/path%3e %3cpath stroke-width='1' id='E1-MJMAIN-29' d='M60 749L64 750Q69 750 74 750H86L114 726Q208 641 251 514T294 250Q294 182 284 119T261 12T224 -76T186 -143T145 -194T113 -227T90 -246Q87 -249 86 -250H74Q66 -250 63 -250T58 -247T55 -238Q56 -237 66 -225Q221 -64 221 250T66 725Q56 737 55 738Q55 746 60 749Z'%3e%3c/path%3e %3c/defs%3e %3cg stroke='currentColor' fill='currentColor' stroke-width='0' transform='matrix(1 0 0 -1 0 0)' aria-hidden='true'%3e %3cg transform='translate(167%2c0)'%3e %3cg transform='translate(-11%2c0)'%3e %3cuse xlink:href='%23E1-MJMATHI-71' x='0' y='0'%3e%3c/use%3e %3cuse xlink:href='%23E1-MJMAIN-3D' x='738' y='0'%3e%3c/use%3e %3cg transform='translate(1516%2c0)'%3e %3cg transform='translate(397%2c0)'%3e %3crect stroke='none' width='6557' height='60' x='0' y='220'%3e%3c/rect%3e %3cg transform='translate(2883%2c819)'%3e %3cg%3e%3c/g%3e %3cuse xlink:href='%23E1-MJMATHI-71' x='0' y='0'%3e%3c/use%3e %3cuse transform='scale(0.707)' xlink:href='%23E1-MJMATHI-69' x='631' y='-213'%3e%3c/use%3e %3c/g%3e %3cg transform='translate(60%2c-880)'%3e %3cg%3e%3c/g%3e %3cuse xlink:href='%23E1-MJMAIN-28' x='0' y='0'%3e%3c/use%3e %3cuse xlink:href='%23E1-MJMAIN-31' x='389' y='0'%3e%3c/use%3e %3cuse xlink:href='%23E1-MJMAIN-2B' x='1112' y='0'%3e%3c/use%3e %3cg transform='translate(2112%2c0)'%3e %3cuse xlink:href='%23E1-MJMATHI-64' x='0' y='0'%3e%3c/use%3e %3cuse transform='scale(0.707)' xlink:href='%23E1-MJMATHI-69' x='736' y='-213'%3e%3c/use%3e %3c/g%3e %3cuse xlink:href='%23E1-MJMAIN-28' x='2977' y='0'%3e%3c/use%3e %3cuse xlink:href='%23E1-MJMATHI-74' x='3367' y='0'%3e%3c/use%3e %3cuse xlink:href='%23E1-MJMAIN-2212' x='3950' y='0'%3e%3c/use%3e %3cuse xlink:href='%23E1-MJMATHI-74' x='4951' y='0'%3e%3c/use%3e %3cuse xlink:href='%23E1-MJMATHI-69' x='5313' y='0'%3e%3c/use%3e %3cuse xlink:href='%23E1-MJMAIN-29' x='5658' y='0'%3e%3c/use%3e %3cuse xlink:href='%23E1-MJMAIN-29' x='6048' y='0'%3e%3c/use%3e %3c/g%3e %3c/g%3e %3c/g%3e %3c/g%3e %3c/g%3e %3c/g%3e %3c/svg%3e)
|
%5cend%7barray%7d%3c/title%3e %3cdefs aria-hidden='true'%3e %3cpath stroke-width='1' id='E1-MJMATHI-51' d='M399 -80Q399 -47 400 -30T402 -11V-7L387 -11Q341 -22 303 -22Q208 -22 138 35T51 201Q50 209 50 244Q50 346 98 438T227 601Q351 704 476 704Q514 704 524 703Q621 689 680 617T740 435Q740 255 592 107Q529 47 461 16L444 8V3Q444 2 449 -24T470 -66T516 -82Q551 -82 583 -60T625 -3Q631 11 638 11Q647 11 649 2Q649 -6 639 -34T611 -100T557 -165T481 -194Q399 -194 399 -87V-80ZM636 468Q636 523 621 564T580 625T530 655T477 665Q429 665 379 640Q277 591 215 464T153 216Q153 110 207 59Q231 38 236 38V46Q236 86 269 120T347 155Q372 155 390 144T417 114T429 82T435 55L448 64Q512 108 557 185T619 334T636 468ZM314 18Q362 18 404 39L403 49Q399 104 366 115Q354 117 347 117Q344 117 341 117T337 118Q317 118 296 98T274 52Q274 18 314 18Z'%3e%3c/path%3e %3cpath stroke-width='1' id='E1-MJMAIN-3D' d='M56 347Q56 360 70 367H707Q722 359 722 347Q722 336 708 328L390 327H72Q56 332 56 347ZM56 153Q56 168 72 173H708Q722 163 722 153Q722 140 707 133H70Q56 140 56 153Z'%3e%3c/path%3e %3cpath stroke-width='1' id='E1-MJMATHI-71' d='M33 157Q33 258 109 349T280 441Q340 441 372 389Q373 390 377 395T388 406T404 418Q438 442 450 442Q454 442 457 439T460 434Q460 425 391 149Q320 -135 320 -139Q320 -147 365 -148H390Q396 -156 396 -157T393 -175Q389 -188 383 -194H370Q339 -192 262 -192Q234 -192 211 -192T174 -192T157 -193Q143 -193 143 -185Q143 -182 145 -170Q149 -154 152 -151T172 -148Q220 -148 230 -141Q238 -136 258 -53T279 32Q279 33 272 29Q224 -10 172 -10Q117 -10 75 30T33 157ZM352 326Q329 405 277 405Q242 405 210 374T160 293Q131 214 119 129Q119 126 119 118T118 106Q118 61 136 44T179 26Q233 26 290 98L298 109L352 326Z'%3e%3c/path%3e %3cpath stroke-width='1' id='E1-MJMATHI-69' d='M184 600Q184 624 203 642T247 661Q265 661 277 649T290 619Q290 596 270 577T226 557Q211 557 198 567T184 600ZM21 287Q21 295 30 318T54 369T98 420T158 442Q197 442 223 419T250 357Q250 340 236 301T196 196T154 83Q149 61 149 51Q149 26 166 26Q175 26 185 29T208 43T235 78T260 137Q263 149 265 151T282 153Q302 153 302 143Q302 135 293 112T268 61T223 11T161 -11Q129 -11 102 10T74 74Q74 91 79 106T122 220Q160 321 166 341T173 380Q173 404 156 404H154Q124 404 99 371T61 287Q60 286 59 284T58 281T56 279T53 278T49 278T41 278H27Q21 284 21 287Z'%3e%3c/path%3e %3cpath stroke-width='1' id='E1-MJMATHI-64' d='M366 683Q367 683 438 688T511 694Q523 694 523 686Q523 679 450 384T375 83T374 68Q374 26 402 26Q411 27 422 35Q443 55 463 131Q469 151 473 152Q475 153 483 153H487H491Q506 153 506 145Q506 140 503 129Q490 79 473 48T445 8T417 -8Q409 -10 393 -10Q359 -10 336 5T306 36L300 51Q299 52 296 50Q294 48 292 46Q233 -10 172 -10Q117 -10 75 30T33 157Q33 205 53 255T101 341Q148 398 195 420T280 442Q336 442 364 400Q369 394 369 396Q370 400 396 505T424 616Q424 629 417 632T378 637H357Q351 643 351 645T353 664Q358 683 366 683ZM352 326Q329 405 277 405Q242 405 210 374T160 293Q131 214 119 129Q119 126 119 118T118 106Q118 61 136 44T179 26Q233 26 290 98L298 109L352 326Z'%3e%3c/path%3e %3cpath stroke-width='1' id='E1-MJMAIN-6C' d='M42 46H56Q95 46 103 60V68Q103 77 103 91T103 124T104 167T104 217T104 272T104 329Q104 366 104 407T104 482T104 542T103 586T103 603Q100 622 89 628T44 637H26V660Q26 683 28 683L38 684Q48 685 67 686T104 688Q121 689 141 690T171 693T182 694H185V379Q185 62 186 60Q190 52 198 49Q219 46 247 46H263V0H255L232 1Q209 2 183 2T145 3T107 3T57 1L34 0H26V46H42Z'%3e%3c/path%3e %3cpath stroke-width='1' id='E1-MJMAIN-6E' d='M41 46H55Q94 46 102 60V68Q102 77 102 91T102 122T103 161T103 203Q103 234 103 269T102 328V351Q99 370 88 376T43 385H25V408Q25 431 27 431L37 432Q47 433 65 434T102 436Q119 437 138 438T167 441T178 442H181V402Q181 364 182 364T187 369T199 384T218 402T247 421T285 437Q305 442 336 442Q450 438 463 329Q464 322 464 190V104Q464 66 466 59T477 49Q498 46 526 46H542V0H534L510 1Q487 2 460 2T422 3Q319 3 310 0H302V46H318Q379 46 379 62Q380 64 380 200Q379 335 378 343Q372 371 358 385T334 402T308 404Q263 404 229 370Q202 343 195 315T187 232V168V108Q187 78 188 68T191 55T200 49Q221 46 249 46H265V0H257L234 1Q210 2 183 2T145 3Q42 3 33 0H25V46H41Z'%3e%3c/path%3e %3cpath stroke-width='1' id='E1-MJMAIN-28' d='M94 250Q94 319 104 381T127 488T164 576T202 643T244 695T277 729T302 750H315H319Q333 750 333 741Q333 738 316 720T275 667T226 581T184 443T167 250T184 58T225 -81T274 -167T316 -220T333 -241Q333 -250 318 -250H315H302L274 -226Q180 -141 137 -14T94 250Z'%3e%3c/path%3e %3cpath stroke-width='1' id='E1-MJMAIN-29' d='M60 749L64 750Q69 750 74 750H86L114 726Q208 641 251 514T294 250Q294 182 284 119T261 12T224 -76T186 -143T145 -194T113 -227T90 -246Q87 -249 86 -250H74Q66 -250 63 -250T58 -247T55 -238Q56 -237 66 -225Q221 -64 221 250T66 725Q56 737 55 738Q55 746 60 749Z'%3e%3c/path%3e %3cpath stroke-width='1' id='E1-MJSZ4-28' d='M758 -1237T758 -1240T752 -1249H736Q718 -1249 717 -1248Q711 -1245 672 -1199Q237 -706 237 251T672 1700Q697 1730 716 1749Q718 1750 735 1750H752Q758 1744 758 1741Q758 1737 740 1713T689 1644T619 1537T540 1380T463 1176Q348 802 348 251Q348 -242 441 -599T744 -1218Q758 -1237 758 -1240Z'%3e%3c/path%3e %3cpath stroke-width='1' id='E1-MJSZ4-29' d='M33 1741Q33 1750 51 1750H60H65Q73 1750 81 1743T119 1700Q554 1207 554 251Q554 -707 119 -1199Q76 -1250 66 -1250Q65 -1250 62 -1250T56 -1249Q55 -1249 53 -1249T49 -1250Q33 -1250 33 -1239Q33 -1236 50 -1214T98 -1150T163 -1052T238 -910T311 -727Q443 -335 443 251Q443 402 436 532T405 831T339 1142T224 1438T50 1716Q33 1737 33 1741Z'%3e%3c/path%3e %3c/defs%3e %3cg stroke='currentColor' fill='currentColor' stroke-width='0' transform='matrix(1 0 0 -1 0 0)' aria-hidden='true'%3e %3cg transform='translate(167%2c0)'%3e %3cg transform='translate(-11%2c0)'%3e %3cuse xlink:href='%23E1-MJMATHI-51' x='0' y='0'%3e%3c/use%3e %3cuse xlink:href='%23E1-MJMAIN-3D' x='1069' y='0'%3e%3c/use%3e %3cg transform='translate(1847%2c0)'%3e %3cg transform='translate(397%2c0)'%3e %3crect stroke='none' width='984' height='60' x='0' y='220'%3e%3c/rect%3e %3cg transform='translate(97%2c819)'%3e %3cg%3e%3c/g%3e %3cuse xlink:href='%23E1-MJMATHI-71' x='0' y='0'%3e%3c/use%3e %3cuse transform='scale(0.707)' xlink:href='%23E1-MJMATHI-69' x='631' y='-213'%3e%3c/use%3e %3c/g%3e %3cg transform='translate(60%2c-880)'%3e %3cg%3e%3c/g%3e %3cuse xlink:href='%23E1-MJMATHI-64' x='0' y='0'%3e%3c/use%3e %3cuse transform='scale(0.707)' xlink:href='%23E1-MJMATHI-69' x='736' y='-213'%3e%3c/use%3e %3c/g%3e %3c/g%3e %3c/g%3e %3cg transform='translate(3350%2c0)'%3e %3cuse xlink:href='%23E1-MJMAIN-6C'%3e%3c/use%3e %3cuse xlink:href='%23E1-MJMAIN-6E' x='278' y='0'%3e%3c/use%3e %3c/g%3e %3cg transform='translate(4185%2c0)'%3e %3cuse xlink:href='%23E1-MJSZ4-28'%3e%3c/use%3e %3cg transform='translate(792%2c0)'%3e %3cg transform='translate(120%2c0)'%3e %3crect stroke='none' width='910' height='60' x='0' y='220'%3e%3c/rect%3e %3cg transform='translate(60%2c819)'%3e %3cg%3e%3c/g%3e %3cuse xlink:href='%23E1-MJMATHI-71' x='0' y='0'%3e%3c/use%3e %3cuse transform='scale(0.707)' xlink:href='%23E1-MJMATHI-69' x='631' y='-213'%3e%3c/use%3e %3c/g%3e %3cg transform='translate(225%2c-880)'%3e %3cg%3e%3c/g%3e %3cuse xlink:href='%23E1-MJMATHI-71' x='0' y='0'%3e%3c/use%3e %3c/g%3e %3c/g%3e %3c/g%3e %3cuse xlink:href='%23E1-MJSZ4-29' x='1943' y='0'%3e%3c/use%3e %3c/g%3e %3c/g%3e %3c/g%3e %3c/g%3e %3c/svg%3e)
|
|
Other Identities |
||
|
Loss Ratio |
%7d=-%5cfrac%7bdq%7d%7bdQ%7d%5cend%7barray%7d%3c/title%3e %3cdefs aria-hidden='true'%3e %3cpath stroke-width='1' id='E1-MJMAIN-31' d='M213 578L200 573Q186 568 160 563T102 556H83V602H102Q149 604 189 617T245 641T273 663Q275 666 285 666Q294 666 302 660V361L303 61Q310 54 315 52T339 48T401 46H427V0H416Q395 3 257 3Q121 3 100 0H88V46H114Q136 46 152 46T177 47T193 50T201 52T207 57T213 61V578Z'%3e%3c/path%3e %3cpath stroke-width='1' id='E1-MJMATHI-44' d='M287 628Q287 635 230 637Q207 637 200 638T193 647Q193 655 197 667T204 682Q206 683 403 683Q570 682 590 682T630 676Q702 659 752 597T803 431Q803 275 696 151T444 3L430 1L236 0H125H72Q48 0 41 2T33 11Q33 13 36 25Q40 41 44 43T67 46Q94 46 127 49Q141 52 146 61Q149 65 218 339T287 628ZM703 469Q703 507 692 537T666 584T629 613T590 629T555 636Q553 636 541 636T512 636T479 637H436Q392 637 386 627Q384 623 313 339T242 52Q242 48 253 48T330 47Q335 47 349 47T373 46Q499 46 581 128Q617 164 640 212T683 339T703 469Z'%3e%3c/path%3e %3cpath stroke-width='1' id='E1-MJMAIN-3D' d='M56 347Q56 360 70 367H707Q722 359 722 347Q722 336 708 328L390 327H72Q56 332 56 347ZM56 153Q56 168 72 173H708Q722 163 722 153Q722 140 707 133H70Q56 140 56 153Z'%3e%3c/path%3e %3cpath stroke-width='1' id='E1-MJMAIN-2212' d='M84 237T84 250T98 270H679Q694 262 694 250T679 230H98Q84 237 84 250Z'%3e%3c/path%3e %3cpath stroke-width='1' id='E1-MJMATHI-71' d='M33 157Q33 258 109 349T280 441Q340 441 372 389Q373 390 377 395T388 406T404 418Q438 442 450 442Q454 442 457 439T460 434Q460 425 391 149Q320 -135 320 -139Q320 -147 365 -148H390Q396 -156 396 -157T393 -175Q389 -188 383 -194H370Q339 -192 262 -192Q234 -192 211 -192T174 -192T157 -193Q143 -193 143 -185Q143 -182 145 -170Q149 -154 152 -151T172 -148Q220 -148 230 -141Q238 -136 258 -53T279 32Q279 33 272 29Q224 -10 172 -10Q117 -10 75 30T33 157ZM352 326Q329 405 277 405Q242 405 210 374T160 293Q131 214 119 129Q119 126 119 118T118 106Q118 61 136 44T179 26Q233 26 290 98L298 109L352 326Z'%3e%3c/path%3e %3cpath stroke-width='1' id='E1-MJMAIN-28' d='M94 250Q94 319 104 381T127 488T164 576T202 643T244 695T277 729T302 750H315H319Q333 750 333 741Q333 738 316 720T275 667T226 581T184 443T167 250T184 58T225 -81T274 -167T316 -220T333 -241Q333 -250 318 -250H315H302L274 -226Q180 -141 137 -14T94 250Z'%3e%3c/path%3e %3cpath stroke-width='1' id='E1-MJMATHI-64' d='M366 683Q367 683 438 688T511 694Q523 694 523 686Q523 679 450 384T375 83T374 68Q374 26 402 26Q411 27 422 35Q443 55 463 131Q469 151 473 152Q475 153 483 153H487H491Q506 153 506 145Q506 140 503 129Q490 79 473 48T445 8T417 -8Q409 -10 393 -10Q359 -10 336 5T306 36L300 51Q299 52 296 50Q294 48 292 46Q233 -10 172 -10Q117 -10 75 30T33 157Q33 205 53 255T101 341Q148 398 195 420T280 442Q336 442 364 400Q369 394 369 396Q370 400 396 505T424 616Q424 629 417 632T378 637H357Q351 643 351 645T353 664Q358 683 366 683ZM352 326Q329 405 277 405Q242 405 210 374T160 293Q131 214 119 129Q119 126 119 118T118 106Q118 61 136 44T179 26Q233 26 290 98L298 109L352 326Z'%3e%3c/path%3e %3cpath stroke-width='1' id='E1-MJMATHI-74' d='M26 385Q19 392 19 395Q19 399 22 411T27 425Q29 430 36 430T87 431H140L159 511Q162 522 166 540T173 566T179 586T187 603T197 615T211 624T229 626Q247 625 254 615T261 596Q261 589 252 549T232 470L222 433Q222 431 272 431H323Q330 424 330 420Q330 398 317 385H210L174 240Q135 80 135 68Q135 26 162 26Q197 26 230 60T283 144Q285 150 288 151T303 153H307Q322 153 322 145Q322 142 319 133Q314 117 301 95T267 48T216 6T155 -11Q125 -11 98 4T59 56Q57 64 57 83V101L92 241Q127 382 128 383Q128 385 77 385H26Z'%3e%3c/path%3e %3cpath stroke-width='1' id='E1-MJMAIN-29' d='M60 749L64 750Q69 750 74 750H86L114 726Q208 641 251 514T294 250Q294 182 284 119T261 12T224 -76T186 -143T145 -194T113 -227T90 -246Q87 -249 86 -250H74Q66 -250 63 -250T58 -247T55 -238Q56 -237 66 -225Q221 -64 221 250T66 725Q56 737 55 738Q55 746 60 749Z'%3e%3c/path%3e %3cpath stroke-width='1' id='E1-MJSZ2-28' d='M180 96T180 250T205 541T266 770T353 944T444 1069T527 1150H555Q561 1144 561 1141Q561 1137 545 1120T504 1072T447 995T386 878T330 721T288 513T272 251Q272 133 280 56Q293 -87 326 -209T399 -405T475 -531T536 -609T561 -640Q561 -643 555 -649H527Q483 -612 443 -568T353 -443T266 -270T205 -41Z'%3e%3c/path%3e %3cpath stroke-width='1' id='E1-MJSZ2-29' d='M35 1138Q35 1150 51 1150H56H69Q113 1113 153 1069T243 944T330 771T391 541T416 250T391 -40T330 -270T243 -443T152 -568T69 -649H56Q43 -649 39 -647T35 -637Q65 -607 110 -548Q283 -316 316 56Q324 133 324 251Q324 368 316 445Q278 877 48 1123Q36 1137 35 1138Z'%3e%3c/path%3e %3cpath stroke-width='1' id='E1-MJMATHI-51' d='M399 -80Q399 -47 400 -30T402 -11V-7L387 -11Q341 -22 303 -22Q208 -22 138 35T51 201Q50 209 50 244Q50 346 98 438T227 601Q351 704 476 704Q514 704 524 703Q621 689 680 617T740 435Q740 255 592 107Q529 47 461 16L444 8V3Q444 2 449 -24T470 -66T516 -82Q551 -82 583 -60T625 -3Q631 11 638 11Q647 11 649 2Q649 -6 639 -34T611 -100T557 -165T481 -194Q399 -194 399 -87V-80ZM636 468Q636 523 621 564T580 625T530 655T477 665Q429 665 379 640Q277 591 215 464T153 216Q153 110 207 59Q231 38 236 38V46Q236 86 269 120T347 155Q372 155 390 144T417 114T429 82T435 55L448 64Q512 108 557 185T619 334T636 468ZM314 18Q362 18 404 39L403 49Q399 104 366 115Q354 117 347 117Q344 117 341 117T337 118Q317 118 296 98T274 52Q274 18 314 18Z'%3e%3c/path%3e %3c/defs%3e %3cg stroke='currentColor' fill='currentColor' stroke-width='0' transform='matrix(1 0 0 -1 0 0)' aria-hidden='true'%3e %3cg transform='translate(167%2c0)'%3e %3cg transform='translate(-11%2c0)'%3e %3cg transform='translate(0%2c320)'%3e %3cg transform='translate(120%2c0)'%3e %3crect stroke='none' width='948' height='60' x='0' y='220'%3e%3c/rect%3e %3cuse xlink:href='%23E1-MJMAIN-31' x='224' y='676'%3e%3c/use%3e %3cuse xlink:href='%23E1-MJMATHI-44' x='60' y='-704'%3e%3c/use%3e %3c/g%3e %3cuse xlink:href='%23E1-MJMAIN-3D' x='1466' y='0'%3e%3c/use%3e %3cg transform='translate(2244%2c0)'%3e %3cg transform='translate(397%2c0)'%3e %3crect stroke='none' width='2370' height='60' x='0' y='220'%3e%3c/rect%3e %3cg transform='translate(565%2c819)'%3e %3cg%3e%3c/g%3e %3cuse xlink:href='%23E1-MJMAIN-2212' x='0' y='0'%3e%3c/use%3e %3cuse xlink:href='%23E1-MJMATHI-71' x='778' y='0'%3e%3c/use%3e %3c/g%3e %3cg transform='translate(60%2c-1170)'%3e %3cg%3e%3c/g%3e %3cuse xlink:href='%23E1-MJSZ2-28'%3e%3c/use%3e %3cg transform='translate(597%2c0)'%3e %3cg transform='translate(120%2c0)'%3e %3crect stroke='none' width='815' height='60' x='0' y='220'%3e%3c/rect%3e %3cg transform='translate(60%2c582)'%3e %3cuse transform='scale(0.707)' xlink:href='%23E1-MJMATHI-64' x='0' y='0'%3e%3c/use%3e %3cuse transform='scale(0.707)' xlink:href='%23E1-MJMATHI-71' x='523' y='0'%3e%3c/use%3e %3c/g%3e %3cg transform='translate(95%2c-436)'%3e %3cuse transform='scale(0.707)' xlink:href='%23E1-MJMATHI-64' x='0' y='0'%3e%3c/use%3e %3cuse transform='scale(0.707)' xlink:href='%23E1-MJMATHI-74' x='523' y='0'%3e%3c/use%3e %3c/g%3e %3c/g%3e %3c/g%3e %3cuse xlink:href='%23E1-MJSZ2-29' x='1653' y='-1'%3e%3c/use%3e %3c/g%3e %3c/g%3e %3c/g%3e %3cuse xlink:href='%23E1-MJMAIN-3D' x='5411' y='0'%3e%3c/use%3e %3cuse xlink:href='%23E1-MJMAIN-2212' x='6467' y='0'%3e%3c/use%3e %3cg transform='translate(7245%2c0)'%3e %3cg transform='translate(120%2c0)'%3e %3crect stroke='none' width='1435' height='60' x='0' y='220'%3e%3c/rect%3e %3cg transform='translate(225%2c714)'%3e %3cuse xlink:href='%23E1-MJMATHI-64' x='0' y='0'%3e%3c/use%3e %3cuse xlink:href='%23E1-MJMATHI-71' x='523' y='0'%3e%3c/use%3e %3c/g%3e %3cg transform='translate(60%2c-725)'%3e %3cuse xlink:href='%23E1-MJMATHI-64' x='0' y='0'%3e%3c/use%3e %3cuse xlink:href='%23E1-MJMATHI-51' x='523' y='0'%3e%3c/use%3e %3c/g%3e %3c/g%3e %3c/g%3e %3c/g%3e %3c/g%3e %3c/g%3e %3c/g%3e %3c/svg%3e)
|
|
|
b-factor |
' aria-hidden='true'%3e %3cg transform='translate(167%2c0)'%3e %3cg transform='translate(-11%2c0)'%3e %3cuse xlink:href='%23E1-MJMATHI-62' x='0' y='0'%3e%3c/use%3e %3cuse xlink:href='%23E1-MJMAIN-3D' x='707' y='0'%3e%3c/use%3e %3cg transform='translate(1485%2c0)'%3e %3cg transform='translate(397%2c0)'%3e %3crect stroke='none' width='1005' height='60' x='0' y='220'%3e%3c/rect%3e %3cuse xlink:href='%23E1-MJMATHI-64' x='240' y='676'%3e%3c/use%3e %3cg transform='translate(60%2c-715)'%3e %3cuse xlink:href='%23E1-MJMATHI-64' x='0' y='0'%3e%3c/use%3e %3cuse xlink:href='%23E1-MJMATHI-74' x='523' y='0'%3e%3c/use%3e %3c/g%3e %3c/g%3e %3c/g%3e %3cg transform='translate(3008%2c0)'%3e %3cuse xlink:href='%23E1-MJSZ3-5B'%3e%3c/use%3e %3cg transform='translate(528%2c0)'%3e %3cg transform='translate(120%2c0)'%3e %3crect stroke='none' width='948' height='60' x='0' y='220'%3e%3c/rect%3e %3cuse xlink:href='%23E1-MJMAIN-31' x='224' y='676'%3e%3c/use%3e %3cuse xlink:href='%23E1-MJMATHI-44' x='60' y='-704'%3e%3c/use%3e %3c/g%3e %3c/g%3e %3cuse xlink:href='%23E1-MJSZ3-5D' x='1717' y='-1'%3e%3c/use%3e %3c/g%3e %3cuse xlink:href='%23E1-MJMAIN-3D' x='5531' y='0'%3e%3c/use%3e %3cuse xlink:href='%23E1-MJMAIN-2212' x='6588' y='0'%3e%3c/use%3e %3cg transform='translate(7366%2c0)'%3e %3cg transform='translate(120%2c0)'%3e %3crect stroke='none' width='1005' height='60' x='0' y='220'%3e%3c/rect%3e %3cuse xlink:href='%23E1-MJMATHI-64' x='240' y='676'%3e%3c/use%3e %3cg transform='translate(60%2c-715)'%3e %3cuse xlink:href='%23E1-MJMATHI-64' x='0' y='0'%3e%3c/use%3e %3cuse xlink:href='%23E1-MJMATHI-74' x='523' y='0'%3e%3c/use%3e %3c/g%3e %3c/g%3e %3c/g%3e %3cg transform='translate(8611%2c0)'%3e %3cg transform='translate(0%2c2037)'%3e %3cuse xlink:href='%23E1-MJSZ4-23A1' x='0' y='-1155'%3e%3c/use%3e %3cuse xlink:href='%23E1-MJSZ4-23A3' x='0' y='-2931'%3e%3c/use%3e %3c/g%3e %3cg transform='translate(667%2c0)'%3e %3cg transform='translate(120%2c0)'%3e %3crect stroke='none' width='1175' height='60' x='0' y='220'%3e%3c/rect%3e %3cuse xlink:href='%23E1-MJMATHI-71' x='357' y='714'%3e%3c/use%3e %3cg transform='translate(60%2c-1094)'%3e %3cg transform='translate(120%2c0)'%3e %3crect stroke='none' width='815' height='60' x='0' y='220'%3e%3c/rect%3e %3cg transform='translate(60%2c582)'%3e %3cuse transform='scale(0.707)' xlink:href='%23E1-MJMATHI-64' x='0' y='0'%3e%3c/use%3e %3cuse transform='scale(0.707)' xlink:href='%23E1-MJMATHI-71' x='523' y='0'%3e%3c/use%3e %3c/g%3e %3cg transform='translate(95%2c-436)'%3e %3cuse transform='scale(0.707)' xlink:href='%23E1-MJMATHI-64' x='0' y='0'%3e%3c/use%3e %3cuse transform='scale(0.707)' xlink:href='%23E1-MJMATHI-74' x='523' y='0'%3e%3c/use%3e %3c/g%3e %3c/g%3e %3c/g%3e %3c/g%3e %3c/g%3e %3cg transform='translate(2083%2c2037)'%3e %3cuse xlink:href='%23E1-MJSZ4-23A4' x='0' y='-1155'%3e%3c/use%3e %3cuse xlink:href='%23E1-MJSZ4-23A6' x='0' y='-2931'%3e%3c/use%3e %3c/g%3e %3c/g%3e %3cuse xlink:href='%23E1-MJMAIN-3D' x='11640' y='0'%3e%3c/use%3e %3cg transform='translate(12418%2c0)'%3e %3cg transform='translate(397%2c0)'%3e %3crect stroke='none' width='1435' height='60' x='0' y='220'%3e%3c/rect%3e %3cg transform='translate(225%2c714)'%3e %3cuse xlink:href='%23E1-MJMATHI-71' x='0' y='0'%3e%3c/use%3e %3cuse xlink:href='%23E1-MJMATHI-64' x='460' y='0'%3e%3c/use%3e %3c/g%3e %3cg transform='translate(60%2c-725)'%3e %3cuse xlink:href='%23E1-MJMATHI-64' x='0' y='0'%3e%3c/use%3e %3cuse xlink:href='%23E1-MJMATHI-51' x='523' y='0'%3e%3c/use%3e %3c/g%3e %3c/g%3e %3c/g%3e %3cg transform='translate(14371%2c0)'%3e %3cuse xlink:href='%23E1-MJSZ3-5B'%3e%3c/use%3e %3cg transform='translate(528%2c0)'%3e %3cg transform='translate(120%2c0)'%3e %3crect stroke='none' width='948' height='60' x='0' y='220'%3e%3c/rect%3e %3cuse xlink:href='%23E1-MJMAIN-31' x='224' y='676'%3e%3c/use%3e %3cuse xlink:href='%23E1-MJMATHI-44' x='60' y='-704'%3e%3c/use%3e %3c/g%3e %3c/g%3e %3cuse xlink:href='%23E1-MJSZ3-5D' x='1717' y='-1'%3e%3c/use%3e %3c/g%3e %3c/g%3e %3c/g%3e %3c/g%3e %3c/svg%3e)
|
|
Arp’s Observations
Arp’s observations for the decline curve exponent (b) were for solution gas-drive reservoirs
|
Arp’s Exponent |
|
|---|---|
|
b = 0 |
|
|
b = 0.1 to 0.4 (maybe up to 0.6) |
|
|
b = 0.4 to 0.5 |
Single Phase Gas Expansion |
|
b = 0.5 |
Gravity drainage with free surface Effective Edge Water Drive |
Table reproduced after T. A. Blasingame (2023)
Others Observations
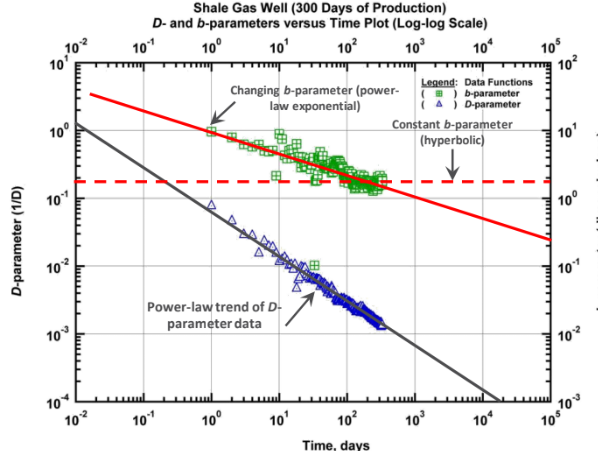
Using traditional Arps decline, Log [decline rate] vs log [time], introduced in 1942, validates the power-law concept found in Decline for Unconventional Reservoirs . The image below (the loss Ratio) shows a power law trend observed from shale gas data.
References
-
T. A. Blasingame, Analysis Well Performance, v20230723, Texas A&M
-
T.A. Blasingame, Pressure Transient Analysis (PTA) , Rate Transient Analysis (RTA) & Decline Curve Analysis (DCA) Methods for Wells in Unconventional Reservoirs. SPE Denver Section. General Meeting 16 December 2020.
-
A New Series of Rate Decline Relations Based on the Diagnosis of Rate-Time Data, A. S. Boulis, B. Ilk, and T. A. Blasingame, Paper 2009-202 [June 2009]
-
Juan Manuel Lacayo Ortiz, Pressure Normalization of Production Rates Improves Forecasting Results, M.Sc. Texas A&m University 2013.