
Introduction
AFA requires at least 1 Project and 1 Group to perform any analyses or simulation. Please refer to Create a Project and sub-topics if required.
STEP 1: Select MASLO autoFMB
The oil FMB is part of the MASLO series of modules as shown below:
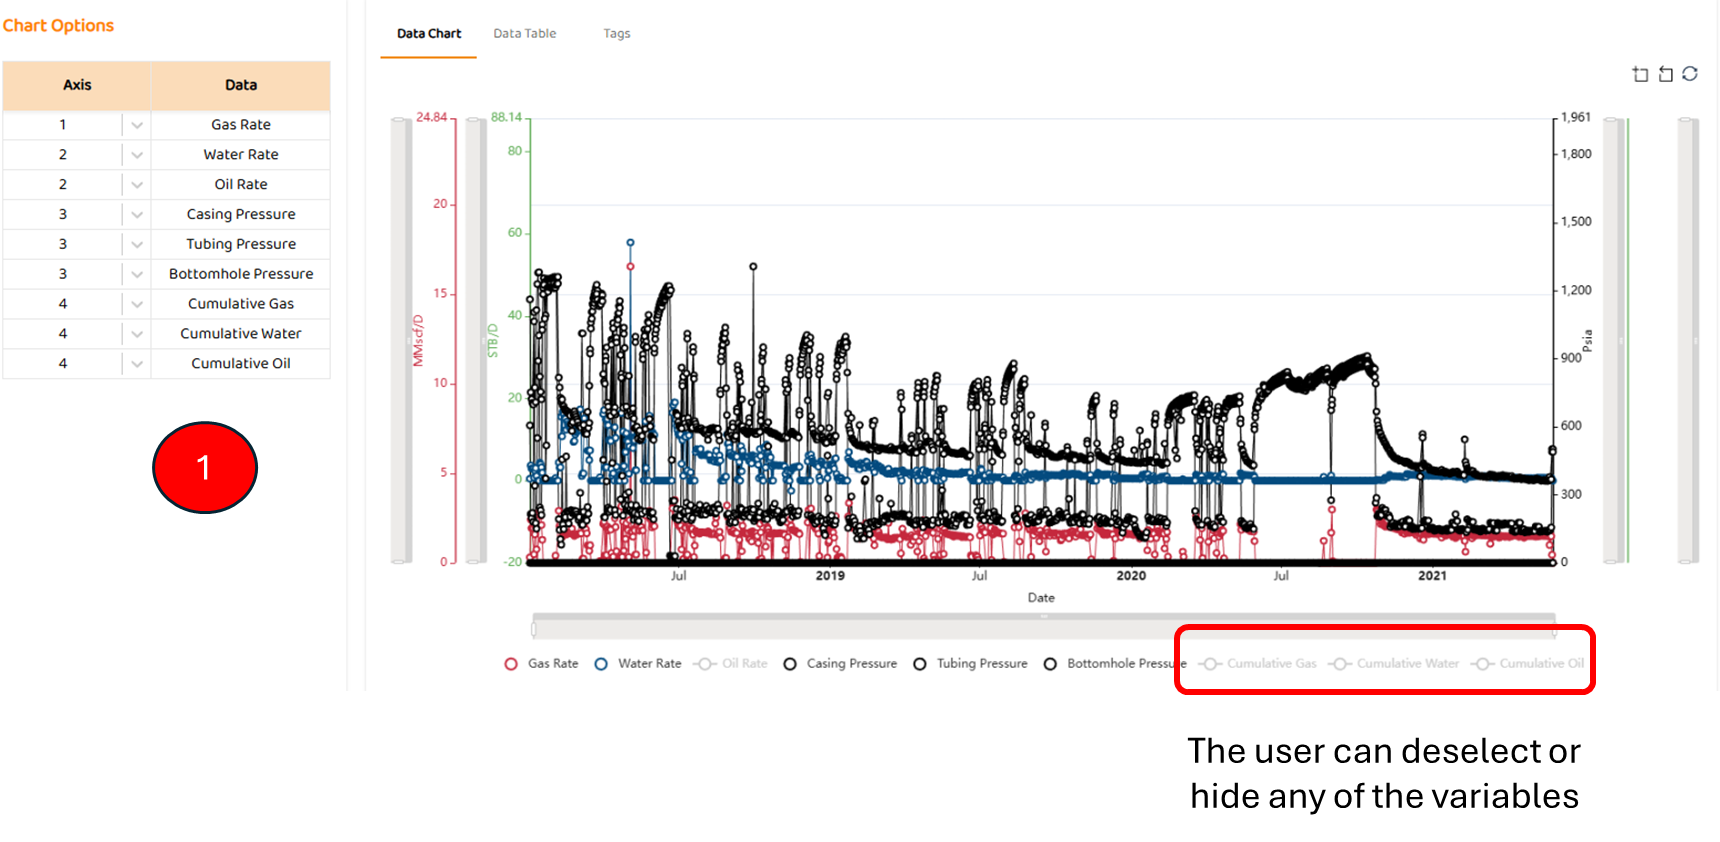
STEP 2: Data View
Data View is the first tab in most modules. It shows all the major data sources imported for this well (pressures, rates, etc). Some specific items are:
-
Options to select which axis a data set below (left or right)
STEP 3: Input Grid
The user must specify all the PVT and rock properties shown below to proceed to the analysis or “FMB Output“ tab. On this tab, there are:
-
Defined Parameters
-
These are generally parameters given by the user including
-
-
PVT inputs and general PVT Correlations and Calculations including recombination calculations.
-
Gas PVT Plots - viscosity, density, z-factor etc
-
Water PVT Plots - viscosity, density, etc
-
Oil PVT Plots - viscosity, density, solution GOR, etc.
-
autoRTA: Langmuir Isotherm (not enabled for oil)
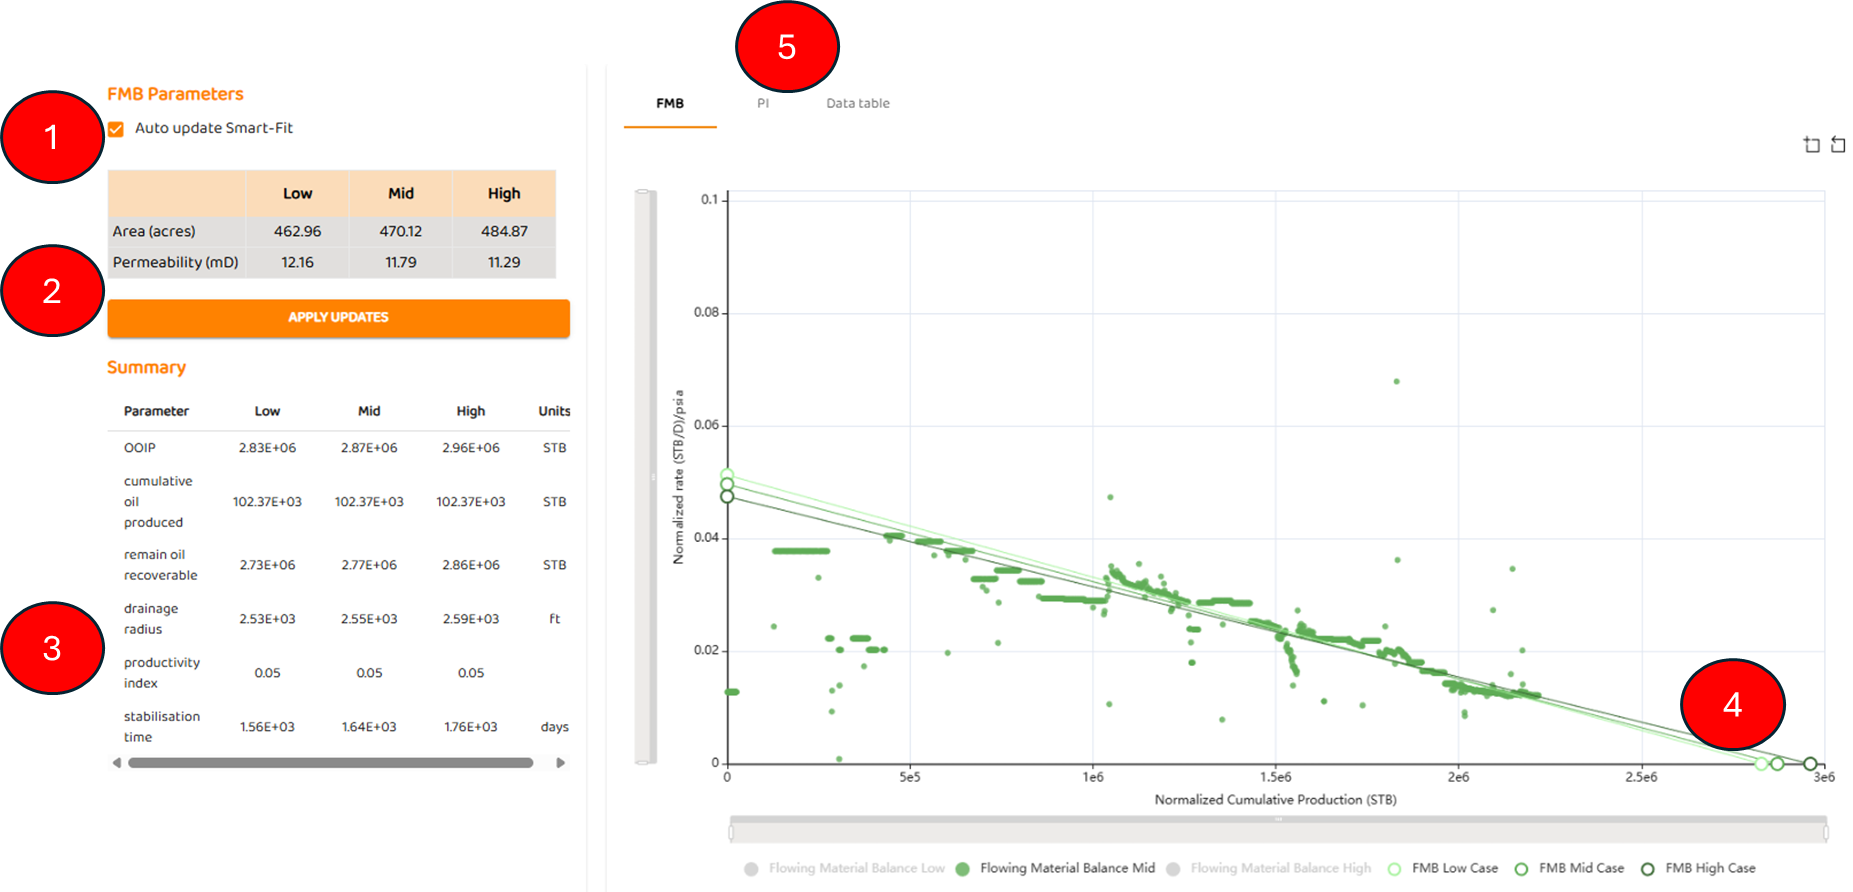
STEP 4: Analysis Tab
The Analysis tab allows the user to perform the actual analysis. There are four (4) main components to autoFMB tab:
4.1 FMB Results
-
Smart-Fit Option - Default status is on. Using data science three full FMB’s are performed to provide low, medium, and high estimates.
-
Drainage Area and Permeability results from automaton
-
OOIP and volumetric results from automation.
-
Stabilization time is also displayed which represents the time to Boundary Dominated Flow.
-
-
Plot of FMB results
Engineering Tips
-
The FMB uses PSS Models and only generates an apparent permeability number which contains the effects of Wellbore Skin and Formation Damage
-
Refer to Scaling in Reservoir Engineering about effective / apparent reservoir models.
-
Refer to Outlier Detection Techniques and Fitting and Repeated Median Regression for additional information on data science.
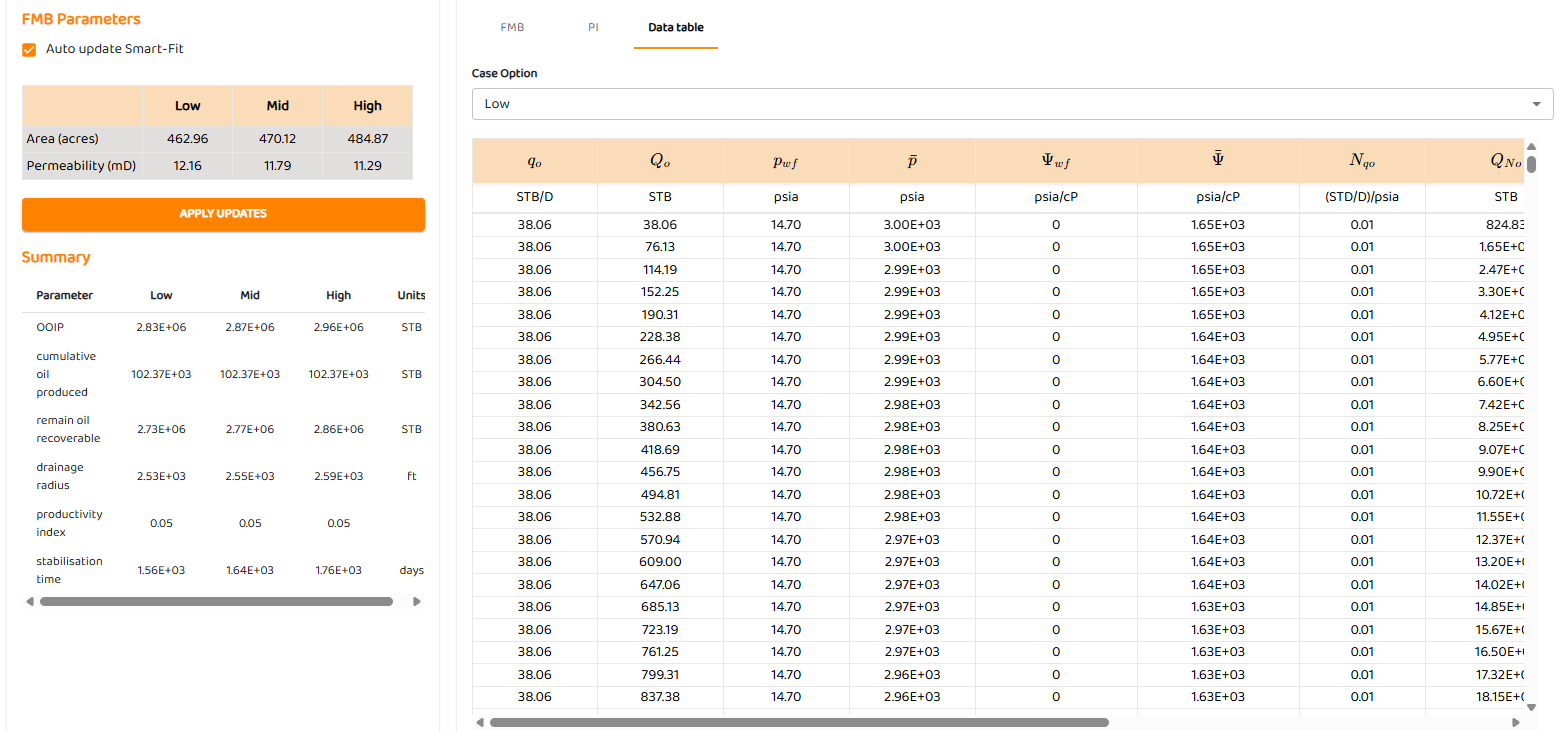
4.2 Data Table of Results
Simply a tabulation of results for all three analyses. You can select to view any sensitivity low, medium or high.
STEP 5: Forecast Tab
The forecast tab simply generates a forecast past the history match period.
The forecast tab simply generates a forecast past the history match period. It contains
-
The Economic Cut-off
-
Summary of results
-
Display of history match and forecast sensitivities (see RTA Sensitivities )
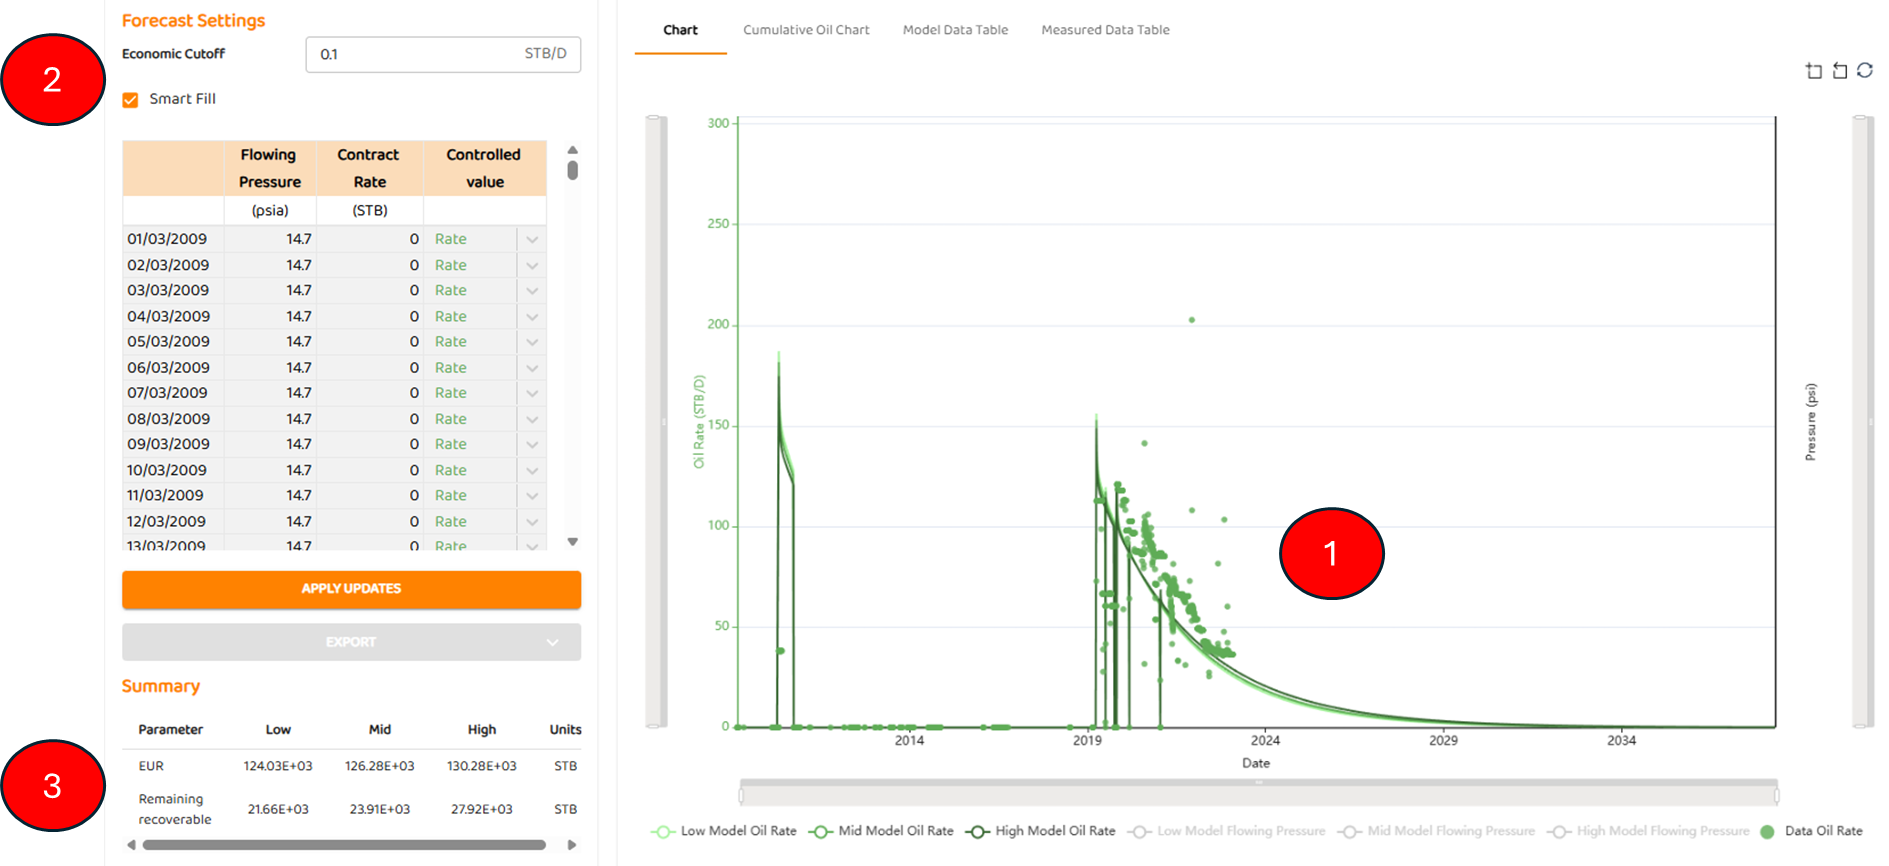
The advanced AFA analytics actually performs and produces three (3) independent forecasts!