Introduction
This plot helps diagnose the quality of the autoFMB. Productivity Index (PI) plot can be selected by choosing the “PI“ tab shown below for either MASLO autoFMB or GAZ: autoFMB .
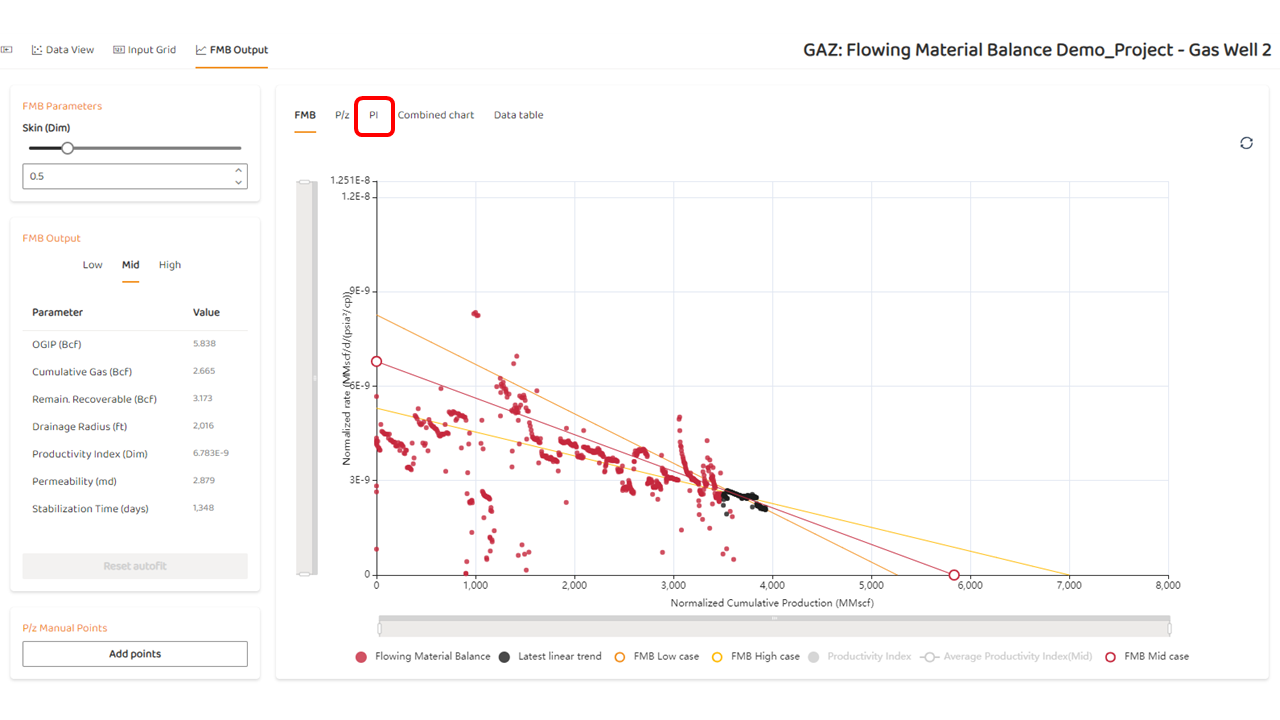
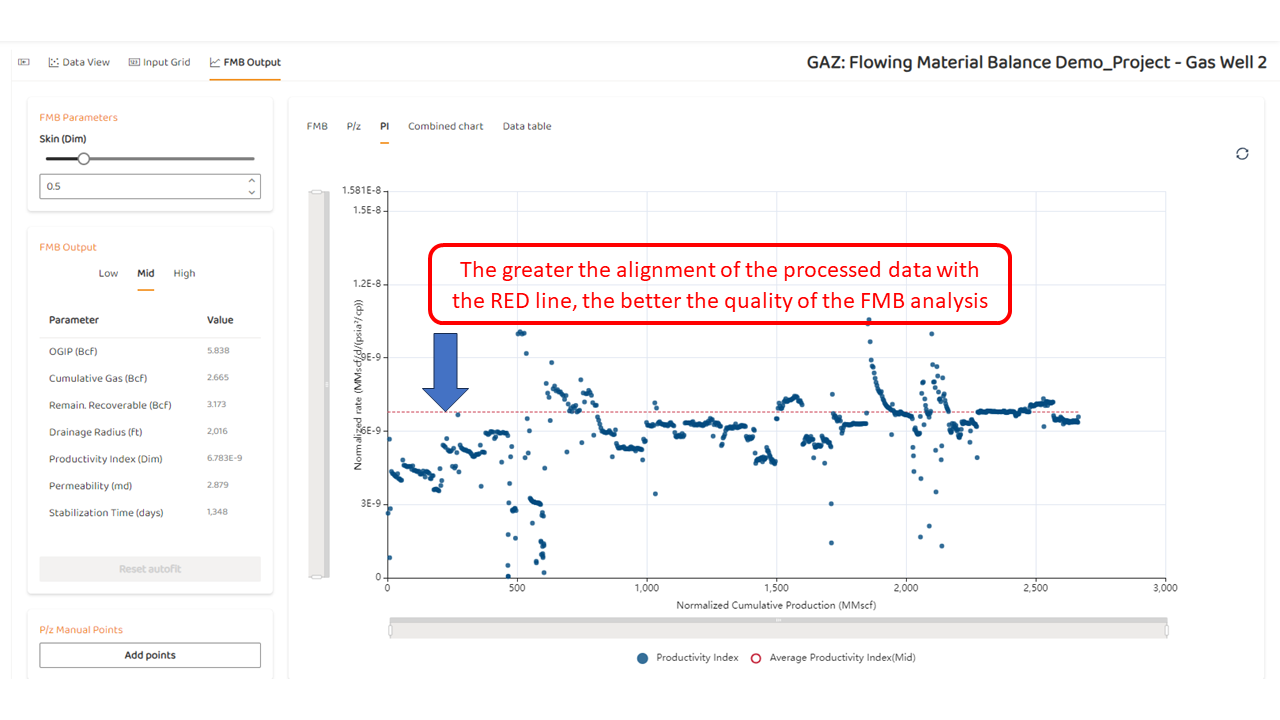
Gas Example
As FMB line (model) and the raw data align for PSS, the Productivity Index (PI) (PI) will become linear (near horizontal).
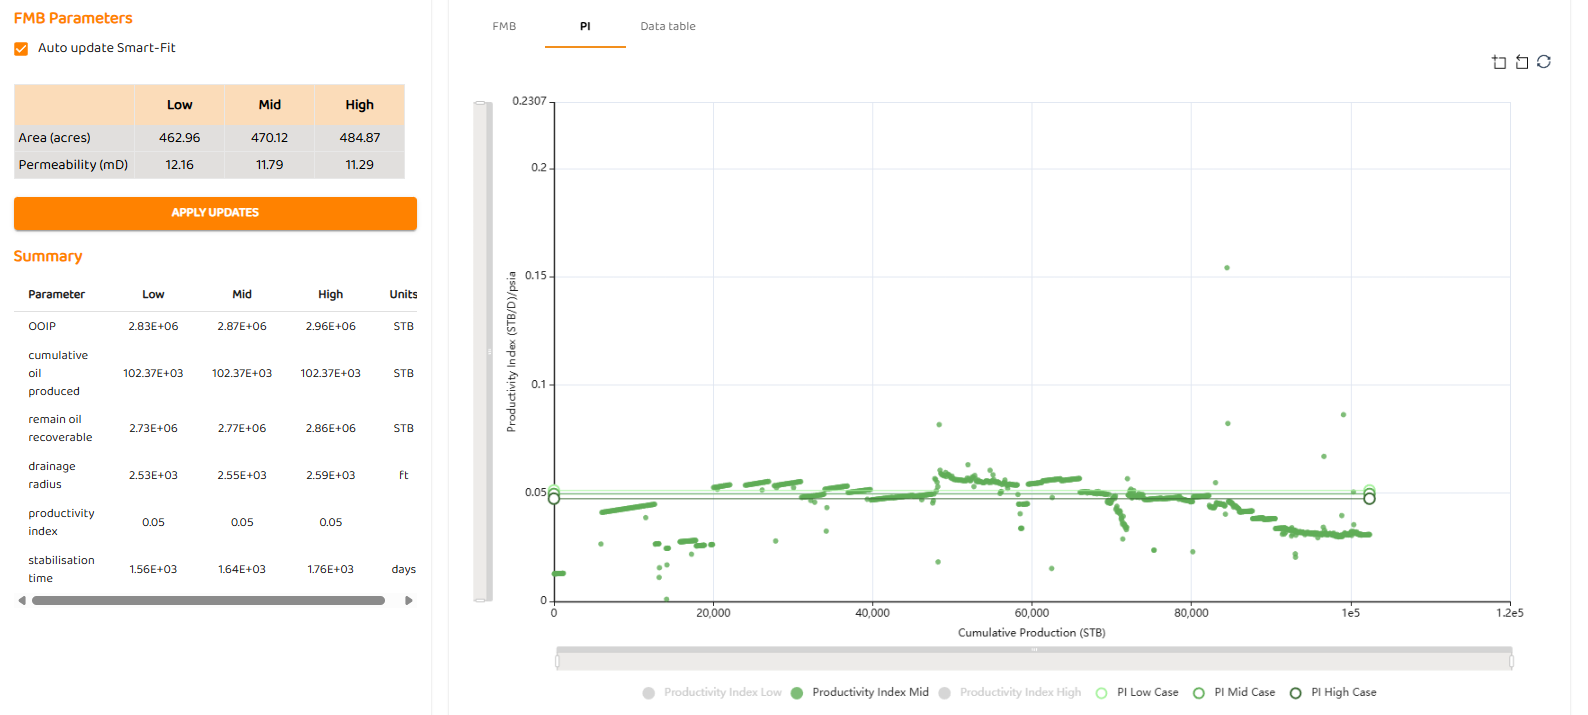
Oil Example
As FMB line (model) and the raw data align for PSS, the Productivity Index (PI) (PI) will become linear (near horizontal).