
Introduction
There are many different methods for estimating permeability of the surface. For simplicity, three (3) are listed below:
Collapse all Expand all Collapse all
-
Pressure Transient Analysis (PTA)
-
Rate Transient Analysis (RTA) or Well Production Analysis (WPA)
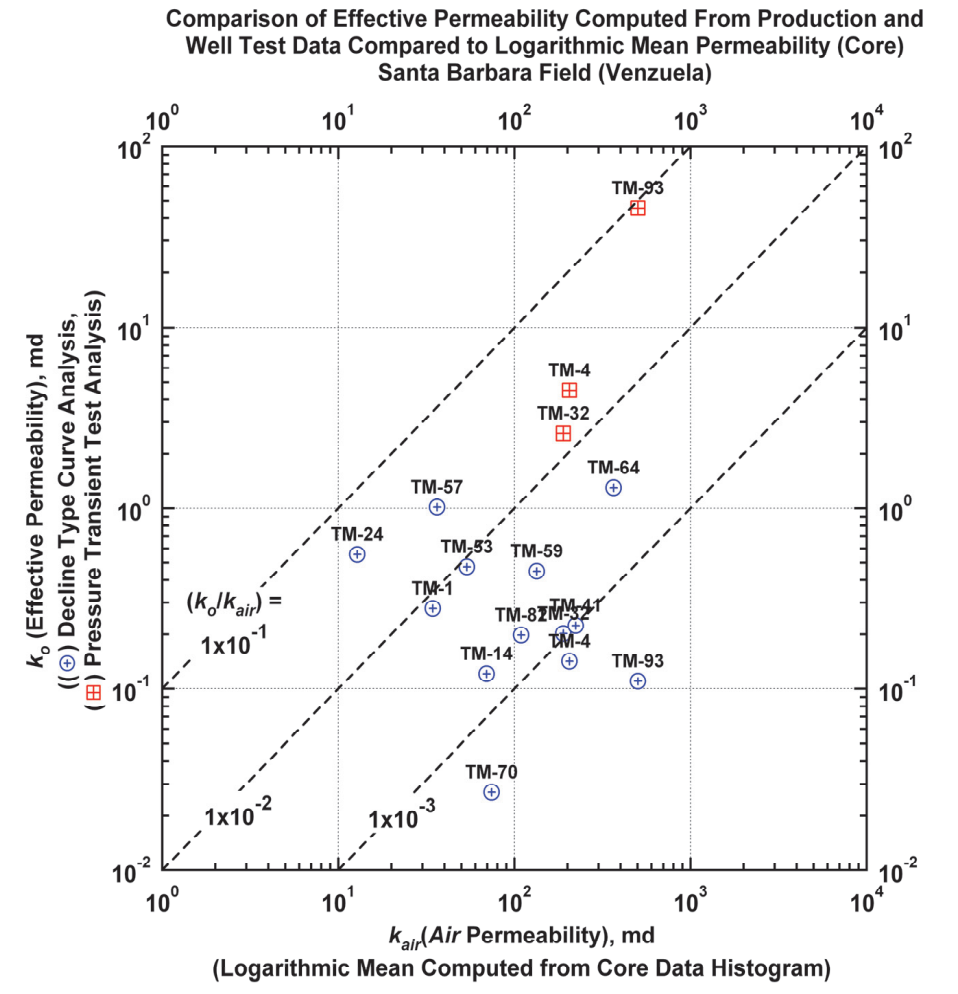
Comparison of Permeability Measurements
The various approaches to measuring permeability have different assumptions, and therefore they can produce different results.
In the example below, permeability determined from PTA, RTA (or WPA) and the mean (or average) from a test core are shown for a project in Venezuela. The conclusion drawn by Blasingame [2014] was that the various methods of estimating permeability due not appear to be correlated. For instance, kPTA values were higher than kRTA values.
Core scale heterogeneities may have no impact on overall reservoir performance, and attempts to correlate small-scale heterogeneities are likely to fail [Blasingame, 2014].
Potential Areas of Conflict
The table below, reproduced from Blasingame [2017], is a list of potential conflicts with permeability and other related parameters. There can easily be two or more sets of data representing the same property.
|
Porosity
|
|
|
|
Permeability
|
|
|
|
Reservoir Pressure
|
|
|
|
Initial Saturations
|
|
|
|
End-Point Saturations
|
|
|
See Also:
-
RTA vs PTA Permeability for additional examples.
References
-
T. A. Blasingame “Formation Evaluation and the Analysis of Reservoir Properties” , Texas A&M University, Course P663 -14 B, 2014.
-
T. A. Blasingame “Formation Evaluation and the Analysis of Reservoir Properties” , Texas A&M University, Course P663 - 17B, 2014.