
General Non-uniqueness
Non-unique history matching is often observed with both empirical and analytical models. In such scenarios, two very general observations can be made:
-
Both history match and forecast are identical which implies the various base models are identical in w/r to productivity (not necessary physical parameters such as permeability etc)
-
The history matches are identical, but the forecasts are radically different. Various physical models may appear similar in one time regime, but different in another.
History Matching and Forecasting
In the examples below, each decline curve analysis (DCA) model matches the data very well, and yet each model has a very different extrapolation. Blasingame [2018] poses the question: Can decline models truly represent well performance.?
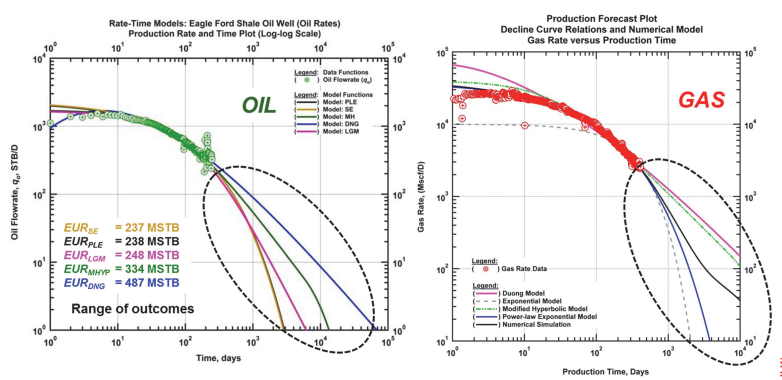
With analytical (or numerical) models, the same thing can happen.
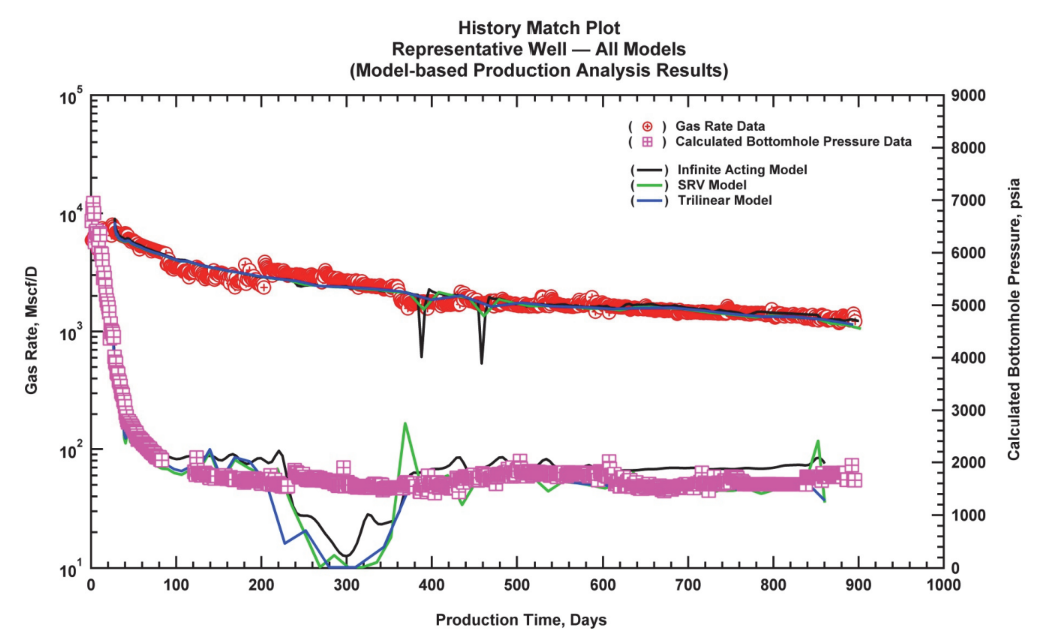
In the example below, a shale gas well (3 years of data) was analysed using three different physical models including:
-
Infinite acting reservoir
-
SRV model: see also Stimulated Rock Volume (SRV)
-
Trilinear Model
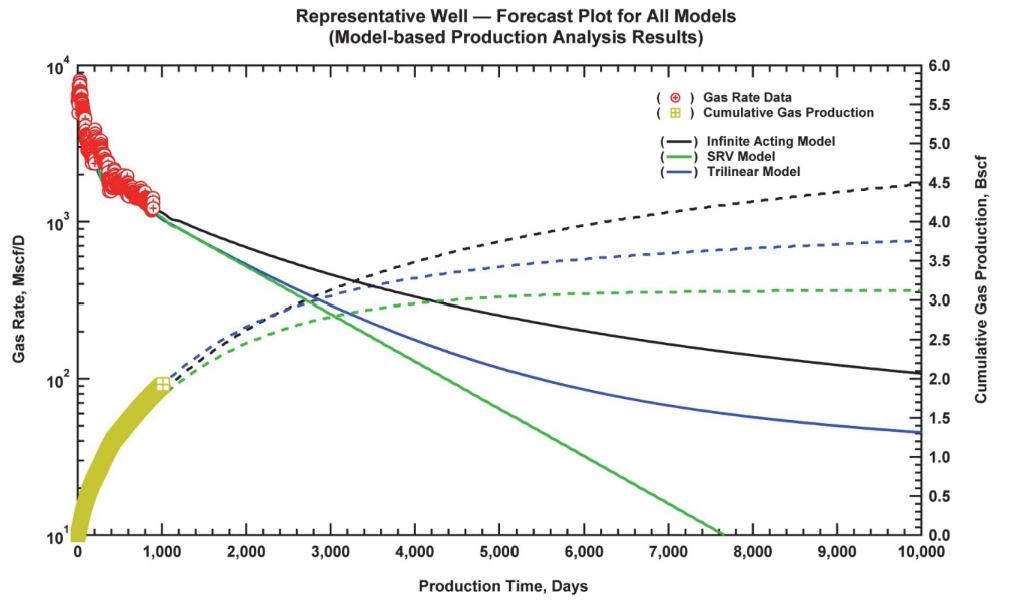
All three models produced comparable rate vs time history matches as shown:
However, when forecasting, each of the model based results produced radically varying forecasts. As demonstrated by Blasingame [2018], the EUR range was from 3.2 to 4.6+ Bscf. The variation in the forecasts was based on the assumed drainage area. In short, all matches are almost identical, but the forecasts are model-dependent.
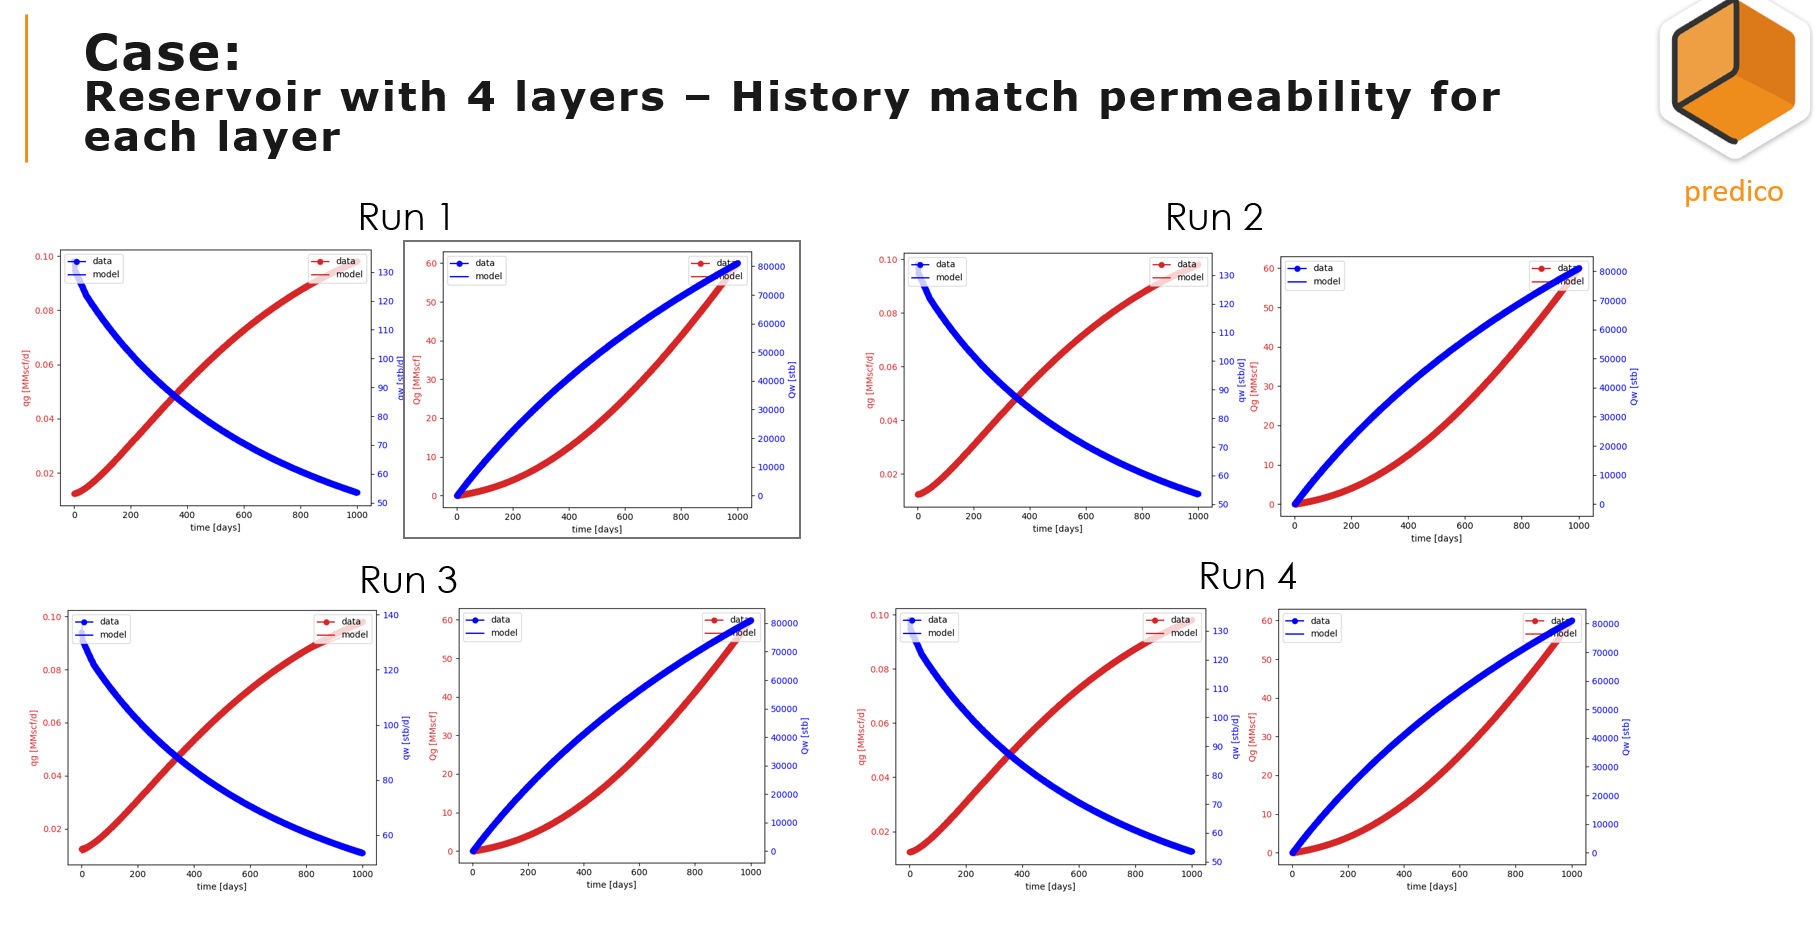
Example: Multiphase Flow in CSG/CBM
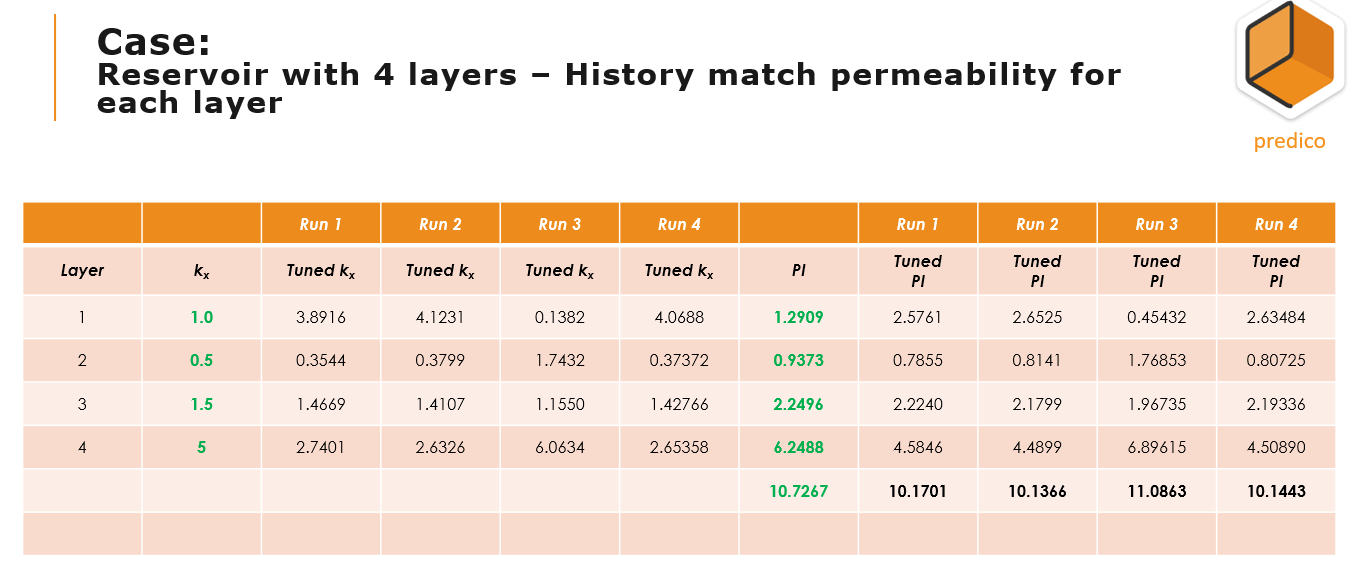
In this example, a simulated data set of 4 layers in a CSG/CBM well was prepared. The AFA optimization algorithm was then applied to see if the unknown permeability per layer was unique (all other parameters were assumed to be known).
As shown below, four individual runs (history matching) were performed.
Permeability Results
-
Permeability for Layer 2 ranged from 0.35 md to nearly 2.0 md.
-
Permeability for Layer 1 ranged from 0.1 to 4.0 md.
-
Permeability for Layer 3 remained relatively constant
-
Permeability for Layer 4 rangedd from 2 to 6 md.
Productivity Results
-
The Productivity Index (PI) varied for each layer and each run.
-
The total Productivity Index (PI) remained relatively constant which means the analyst can perform quality forecasts even if detailed reservoir characterization is not possible.
-
The forecasts for each scenario are almost identifical
References
-
T. A. Blasingame “Reservoir Engineering Aspects of Unconventional Resources: Workflow: Providing a Workflow to Help Quantify Well Performance Uncertainty”, PETE 612, Unconventional Oil and Reservoirs, 2018.