Introduction
The NPI plot is a log-log plot of the Normalized pressure and the following two parameters against dimensionless time:
|
1 |
Normalized Pressure Integral |
' aria-hidden='true'%3e %3cg transform='translate(167%2c0)'%3e %3cg transform='translate(-11%2c0)'%3e %3cg transform='translate(0%2c-60)'%3e %3cuse xlink:href='%23E1-MJMATHI-70' x='0' y='0'%3e%3c/use%3e %3cg transform='translate(503%2c-150)'%3e %3cuse transform='scale(0.707)' xlink:href='%23E1-MJMATHI-44' x='0' y='0'%3e%3c/use%3e %3cuse transform='scale(0.707)' xlink:href='%23E1-MJMATHI-69' x='828' y='0'%3e%3c/use%3e %3c/g%3e %3cuse xlink:href='%23E1-MJMAIN-3D' x='1711' y='0'%3e%3c/use%3e %3cg transform='translate(2489%2c0)'%3e %3cg transform='translate(397%2c0)'%3e %3crect stroke='none' width='1167' height='60' x='0' y='220'%3e%3c/rect%3e %3cuse xlink:href='%23E1-MJMAIN-31' x='333' y='676'%3e%3c/use%3e %3cg transform='translate(60%2c-686)'%3e %3cuse xlink:href='%23E1-MJMATHI-74' x='0' y='0'%3e%3c/use%3e %3cuse transform='scale(0.707)' xlink:href='%23E1-MJMATHI-44' x='511' y='-213'%3e%3c/use%3e %3c/g%3e %3c/g%3e %3c/g%3e %3cg transform='translate(4341%2c0)'%3e %3cuse xlink:href='%23E1-MJSZ2-222B' x='0' y='0'%3e%3c/use%3e %3cg transform='translate(1060%2c1089)'%3e %3cuse transform='scale(0.707)' xlink:href='%23E1-MJMATHI-74' x='0' y='0'%3e%3c/use%3e %3cuse transform='scale(0.574)' xlink:href='%23E1-MJMATHI-44' x='445' y='-260'%3e%3c/use%3e %3c/g%3e %3cuse transform='scale(0.707)' xlink:href='%23E1-MJMAIN-30' x='787' y='-1270'%3e%3c/use%3e %3c/g%3e %3cg transform='translate(6471%2c0)'%3e %3cuse xlink:href='%23E1-MJMATHI-70' x='0' y='0'%3e%3c/use%3e %3cuse transform='scale(0.707)' xlink:href='%23E1-MJMATHI-44' x='712' y='-213'%3e%3c/use%3e %3c/g%3e %3cuse xlink:href='%23E1-MJMATHI-64' x='7660' y='0'%3e%3c/use%3e %3cg transform='translate(8184%2c0)'%3e %3cuse xlink:href='%23E1-MJMATHI-74' x='0' y='0'%3e%3c/use%3e %3cuse transform='scale(0.707)' xlink:href='%23E1-MJMATHI-44' x='511' y='-213'%3e%3c/use%3e %3c/g%3e %3c/g%3e %3c/g%3e %3c/g%3e %3c/g%3e %3c/svg%3e)
|
|
2 |
Normalized Pressure Integral Derivative |
' aria-hidden='true'%3e %3cg transform='translate(167%2c0)'%3e %3cg transform='translate(-11%2c0)'%3e %3cg transform='translate(0%2c-50)'%3e %3cuse xlink:href='%23E1-MJMATHI-70' x='0' y='0'%3e%3c/use%3e %3cg transform='translate(503%2c-150)'%3e %3cuse transform='scale(0.707)' xlink:href='%23E1-MJMATHI-44' x='0' y='0'%3e%3c/use%3e %3cuse transform='scale(0.707)' xlink:href='%23E1-MJMATHI-69' x='828' y='0'%3e%3c/use%3e %3cuse transform='scale(0.707)' xlink:href='%23E1-MJMATHI-64' x='1174' y='0'%3e%3c/use%3e %3c/g%3e %3cuse xlink:href='%23E1-MJMAIN-3D' x='2081' y='0'%3e%3c/use%3e %3cg transform='translate(3137%2c0)'%3e %3cuse xlink:href='%23E1-MJMATHI-70' x='0' y='0'%3e%3c/use%3e %3cg transform='translate(503%2c-150)'%3e %3cuse transform='scale(0.707)' xlink:href='%23E1-MJMATHI-44' x='0' y='0'%3e%3c/use%3e %3cuse transform='scale(0.707)' xlink:href='%23E1-MJMATHI-69' x='828' y='0'%3e%3c/use%3e %3c/g%3e %3c/g%3e %3cuse xlink:href='%23E1-MJMAIN-2212' x='4793' y='0'%3e%3c/use%3e %3cg transform='translate(5794%2c0)'%3e %3cuse xlink:href='%23E1-MJMATHI-70' x='0' y='0'%3e%3c/use%3e %3cuse transform='scale(0.707)' xlink:href='%23E1-MJMATHI-44' x='712' y='-213'%3e%3c/use%3e %3c/g%3e %3c/g%3e %3c/g%3e %3c/g%3e %3c/g%3e %3c/svg%3e)
|
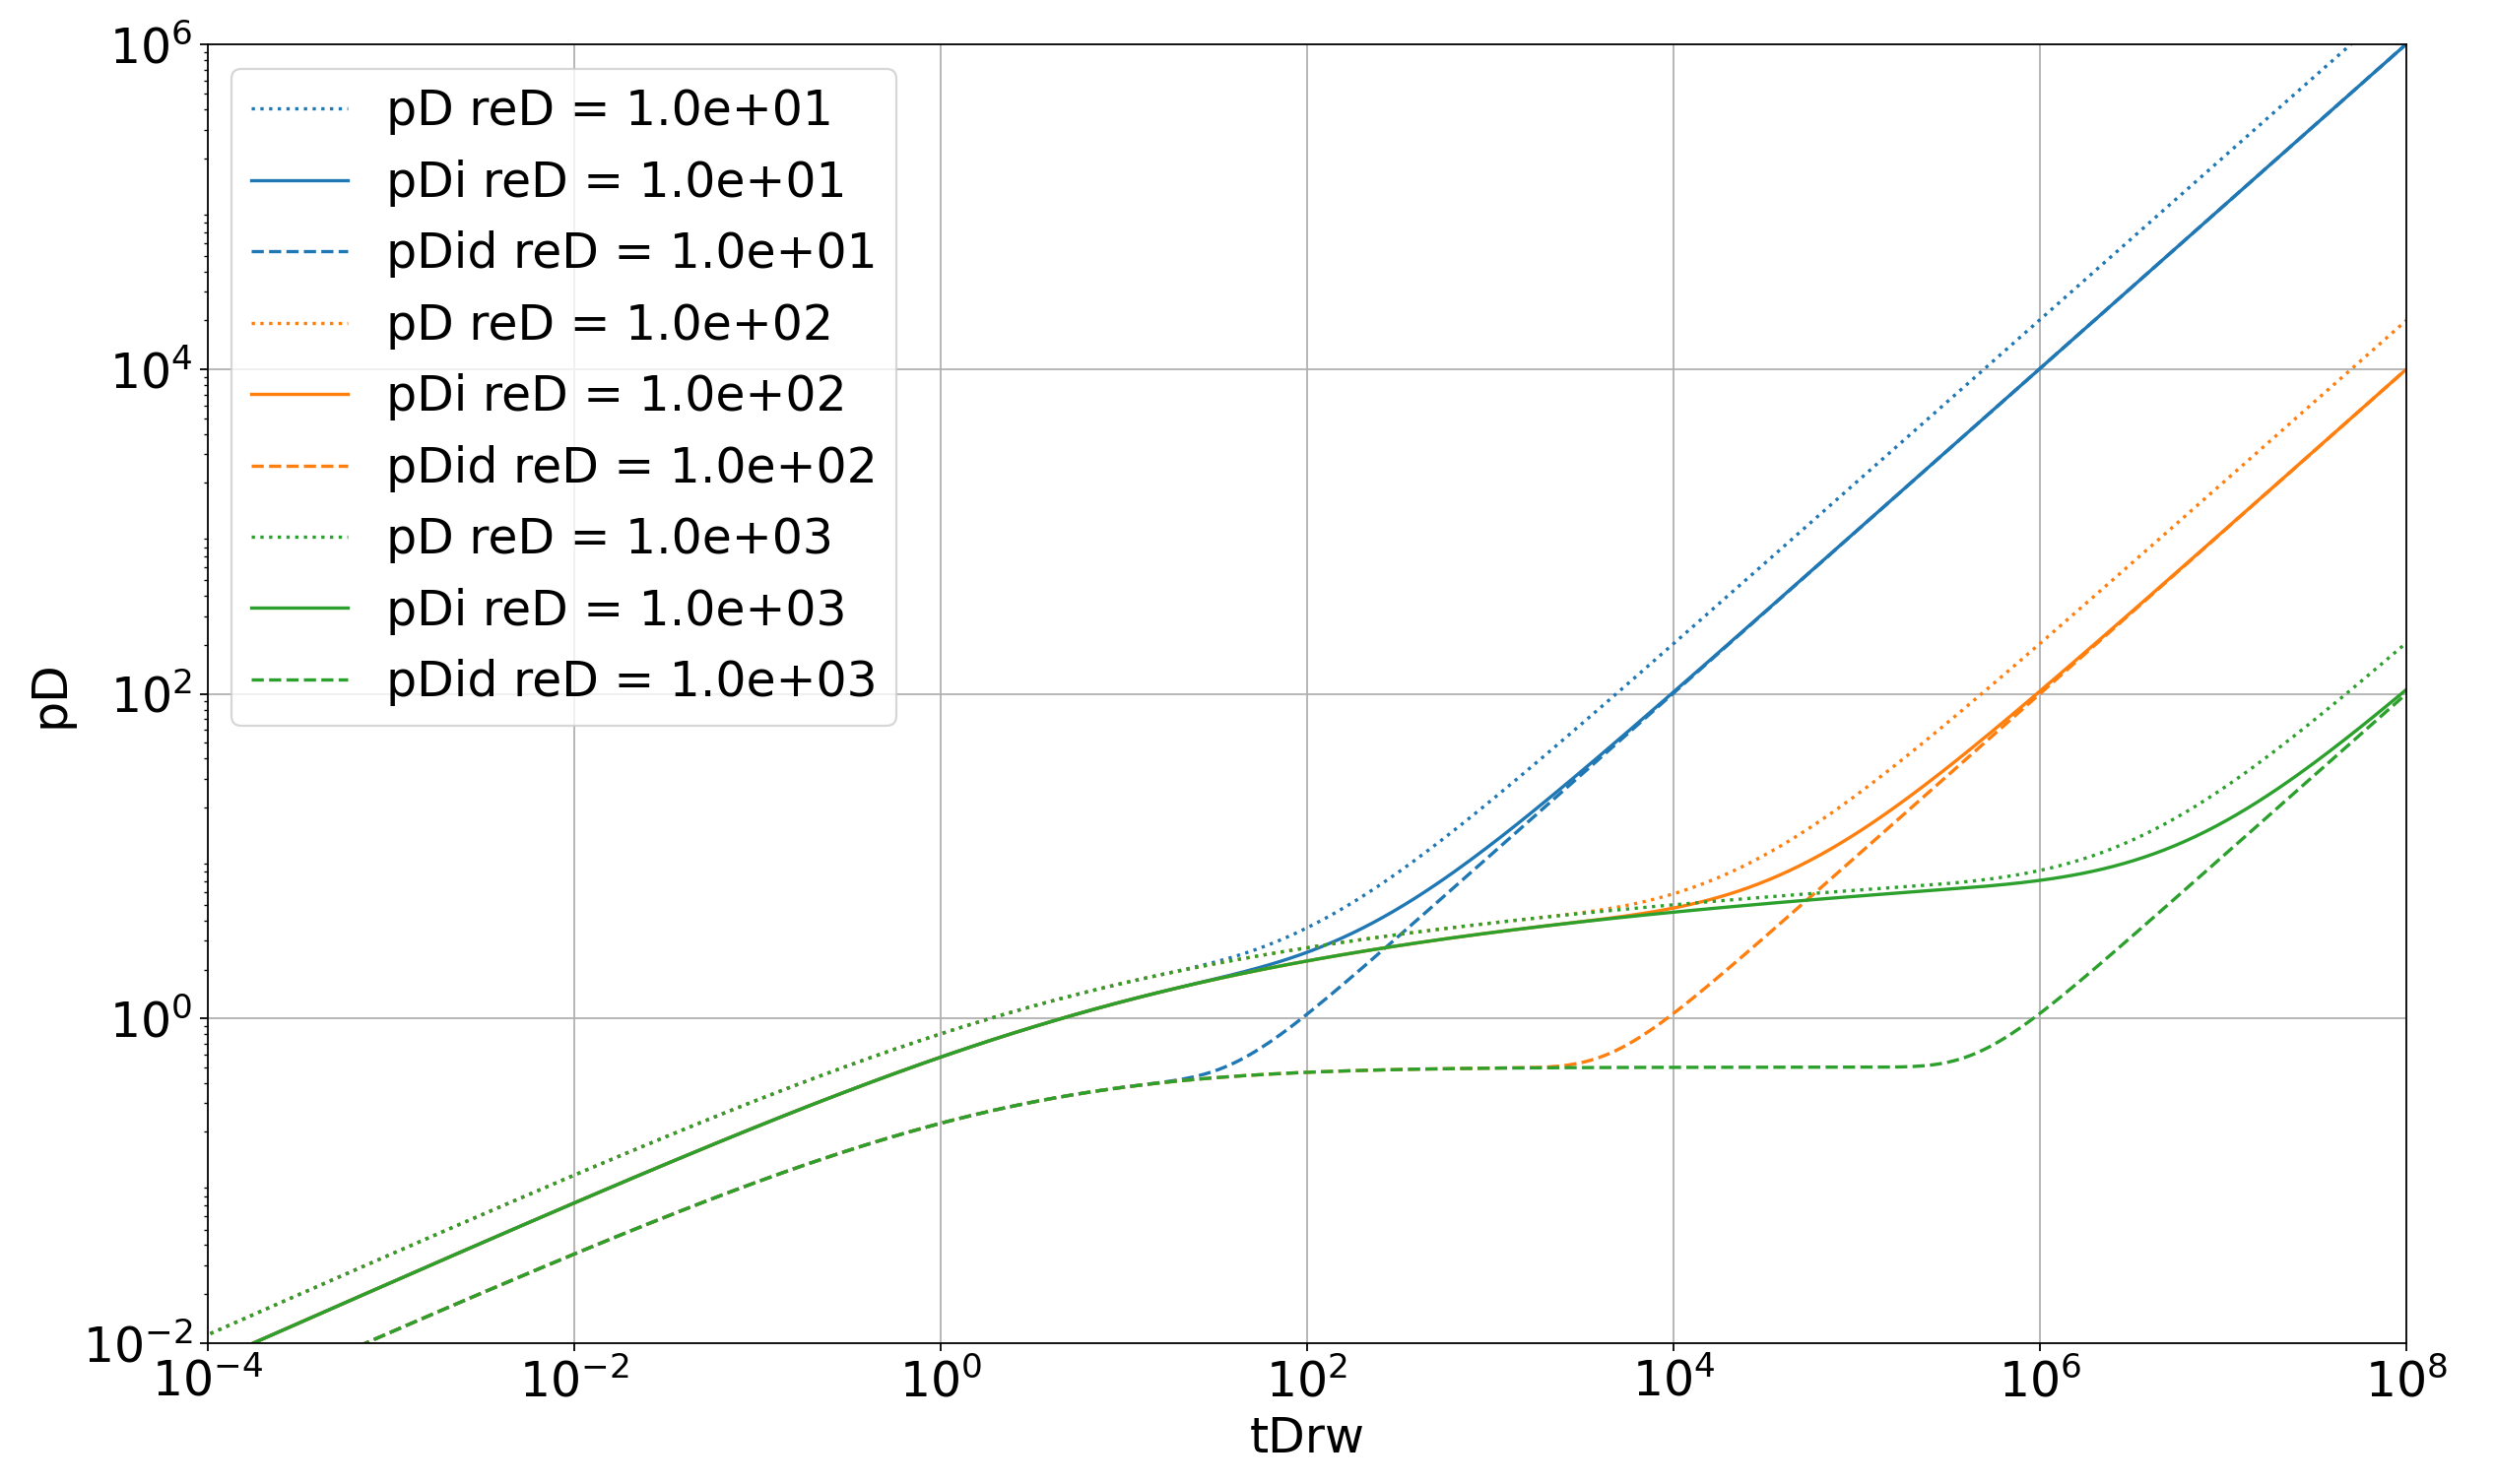
Noisy data can cause difficulty in calculating the Bourdet (Well Testing) derivative. The NPI derivative allows for a smoother derivative function. the NPI derivative can be used to identify the flow regimes in the same manner as the Bourdet (Well Testing) derivative
Similarly with the Blasingame analysis, we need to do some approximation in the early time to evaluate the NPI integral.
%5cend%7barray%7d%3c/title%3e %3cdefs aria-hidden='true'%3e %3cpath stroke-width='1' id='E1-MJMATHI-70' d='M23 287Q24 290 25 295T30 317T40 348T55 381T75 411T101 433T134 442Q209 442 230 378L240 387Q302 442 358 442Q423 442 460 395T497 281Q497 173 421 82T249 -10Q227 -10 210 -4Q199 1 187 11T168 28L161 36Q160 35 139 -51T118 -138Q118 -144 126 -145T163 -148H188Q194 -155 194 -157T191 -175Q188 -187 185 -190T172 -194Q170 -194 161 -194T127 -193T65 -192Q-5 -192 -24 -194H-32Q-39 -187 -39 -183Q-37 -156 -26 -148H-6Q28 -147 33 -136Q36 -130 94 103T155 350Q156 355 156 364Q156 405 131 405Q109 405 94 377T71 316T59 280Q57 278 43 278H29Q23 284 23 287ZM178 102Q200 26 252 26Q282 26 310 49T356 107Q374 141 392 215T411 325V331Q411 405 350 405Q339 405 328 402T306 393T286 380T269 365T254 350T243 336T235 326L232 322Q232 321 229 308T218 264T204 212Q178 106 178 102Z'%3e%3c/path%3e %3cpath stroke-width='1' id='E1-MJMATHI-44' d='M287 628Q287 635 230 637Q207 637 200 638T193 647Q193 655 197 667T204 682Q206 683 403 683Q570 682 590 682T630 676Q702 659 752 597T803 431Q803 275 696 151T444 3L430 1L236 0H125H72Q48 0 41 2T33 11Q33 13 36 25Q40 41 44 43T67 46Q94 46 127 49Q141 52 146 61Q149 65 218 339T287 628ZM703 469Q703 507 692 537T666 584T629 613T590 629T555 636Q553 636 541 636T512 636T479 637H436Q392 637 386 627Q384 623 313 339T242 52Q242 48 253 48T330 47Q335 47 349 47T373 46Q499 46 581 128Q617 164 640 212T683 339T703 469Z'%3e%3c/path%3e %3cpath stroke-width='1' id='E1-MJMATHI-69' d='M184 600Q184 624 203 642T247 661Q265 661 277 649T290 619Q290 596 270 577T226 557Q211 557 198 567T184 600ZM21 287Q21 295 30 318T54 369T98 420T158 442Q197 442 223 419T250 357Q250 340 236 301T196 196T154 83Q149 61 149 51Q149 26 166 26Q175 26 185 29T208 43T235 78T260 137Q263 149 265 151T282 153Q302 153 302 143Q302 135 293 112T268 61T223 11T161 -11Q129 -11 102 10T74 74Q74 91 79 106T122 220Q160 321 166 341T173 380Q173 404 156 404H154Q124 404 99 371T61 287Q60 286 59 284T58 281T56 279T53 278T49 278T41 278H27Q21 284 21 287Z'%3e%3c/path%3e %3cpath stroke-width='1' id='E1-MJMAIN-3D' d='M56 347Q56 360 70 367H707Q722 359 722 347Q722 336 708 328L390 327H72Q56 332 56 347ZM56 153Q56 168 72 173H708Q722 163 722 153Q722 140 707 133H70Q56 140 56 153Z'%3e%3c/path%3e %3cpath stroke-width='1' id='E1-MJMAIN-31' d='M213 578L200 573Q186 568 160 563T102 556H83V602H102Q149 604 189 617T245 641T273 663Q275 666 285 666Q294 666 302 660V361L303 61Q310 54 315 52T339 48T401 46H427V0H416Q395 3 257 3Q121 3 100 0H88V46H114Q136 46 152 46T177 47T193 50T201 52T207 57T213 61V578Z'%3e%3c/path%3e %3cpath stroke-width='1' id='E1-MJMATHI-74' d='M26 385Q19 392 19 395Q19 399 22 411T27 425Q29 430 36 430T87 431H140L159 511Q162 522 166 540T173 566T179 586T187 603T197 615T211 624T229 626Q247 625 254 615T261 596Q261 589 252 549T232 470L222 433Q222 431 272 431H323Q330 424 330 420Q330 398 317 385H210L174 240Q135 80 135 68Q135 26 162 26Q197 26 230 60T283 144Q285 150 288 151T303 153H307Q322 153 322 145Q322 142 319 133Q314 117 301 95T267 48T216 6T155 -11Q125 -11 98 4T59 56Q57 64 57 83V101L92 241Q127 382 128 383Q128 385 77 385H26Z'%3e%3c/path%3e %3cpath stroke-width='1' id='E1-MJMAIN-28' d='M94 250Q94 319 104 381T127 488T164 576T202 643T244 695T277 729T302 750H315H319Q333 750 333 741Q333 738 316 720T275 667T226 581T184 443T167 250T184 58T225 -81T274 -167T316 -220T333 -241Q333 -250 318 -250H315H302L274 -226Q180 -141 137 -14T94 250Z'%3e%3c/path%3e %3cpath stroke-width='1' id='E1-MJSZ2-222B' d='M114 -798Q132 -824 165 -824H167Q195 -824 223 -764T275 -600T320 -391T362 -164Q365 -143 367 -133Q439 292 523 655T645 1127Q651 1145 655 1157T672 1201T699 1257T733 1306T777 1346T828 1360Q884 1360 912 1325T944 1245Q944 1220 932 1205T909 1186T887 1183Q866 1183 849 1198T832 1239Q832 1287 885 1296L882 1300Q879 1303 874 1307T866 1313Q851 1323 833 1323Q819 1323 807 1311T775 1255T736 1139T689 936T633 628Q574 293 510 -5T410 -437T355 -629Q278 -862 165 -862Q125 -862 92 -831T55 -746Q55 -711 74 -698T112 -685Q133 -685 150 -700T167 -741Q167 -789 114 -798Z'%3e%3c/path%3e %3cpath stroke-width='1' id='E1-MJMAIN-30' d='M96 585Q152 666 249 666Q297 666 345 640T423 548Q460 465 460 320Q460 165 417 83Q397 41 362 16T301 -15T250 -22Q224 -22 198 -16T137 16T82 83Q39 165 39 320Q39 494 96 585ZM321 597Q291 629 250 629Q208 629 178 597Q153 571 145 525T137 333Q137 175 145 125T181 46Q209 16 250 16Q290 16 318 46Q347 76 354 130T362 333Q362 478 354 524T321 597Z'%3e%3c/path%3e %3cpath stroke-width='1' id='E1-MJMATHI-64' d='M366 683Q367 683 438 688T511 694Q523 694 523 686Q523 679 450 384T375 83T374 68Q374 26 402 26Q411 27 422 35Q443 55 463 131Q469 151 473 152Q475 153 483 153H487H491Q506 153 506 145Q506 140 503 129Q490 79 473 48T445 8T417 -8Q409 -10 393 -10Q359 -10 336 5T306 36L300 51Q299 52 296 50Q294 48 292 46Q233 -10 172 -10Q117 -10 75 30T33 157Q33 205 53 255T101 341Q148 398 195 420T280 442Q336 442 364 400Q369 394 369 396Q370 400 396 505T424 616Q424 629 417 632T378 637H357Q351 643 351 645T353 664Q358 683 366 683ZM352 326Q329 405 277 405Q242 405 210 374T160 293Q131 214 119 129Q119 126 119 118T118 106Q118 61 136 44T179 26Q233 26 290 98L298 109L352 326Z'%3e%3c/path%3e %3cpath stroke-width='1' id='E1-MJMAIN-2B' d='M56 237T56 250T70 270H369V420L370 570Q380 583 389 583Q402 583 409 568V270H707Q722 262 722 250T707 230H409V-68Q401 -82 391 -82H389H387Q375 -82 369 -68V230H70Q56 237 56 250Z'%3e%3c/path%3e %3cpath stroke-width='1' id='E1-MJMAIN-29' d='M60 749L64 750Q69 750 74 750H86L114 726Q208 641 251 514T294 250Q294 182 284 119T261 12T224 -76T186 -143T145 -194T113 -227T90 -246Q87 -249 86 -250H74Q66 -250 63 -250T58 -247T55 -238Q56 -237 66 -225Q221 -64 221 250T66 725Q56 737 55 738Q55 746 60 749Z'%3e%3c/path%3e %3cpath stroke-width='1' id='E1-MJSZ3-28' d='M701 -940Q701 -943 695 -949H664Q662 -947 636 -922T591 -879T537 -818T475 -737T412 -636T350 -511T295 -362T250 -186T221 17T209 251Q209 962 573 1361Q596 1386 616 1405T649 1437T664 1450H695Q701 1444 701 1441Q701 1436 681 1415T629 1356T557 1261T476 1118T400 927T340 675T308 359Q306 321 306 250Q306 -139 400 -430T690 -924Q701 -936 701 -940Z'%3e%3c/path%3e %3cpath stroke-width='1' id='E1-MJSZ3-29' d='M34 1438Q34 1446 37 1448T50 1450H56H71Q73 1448 99 1423T144 1380T198 1319T260 1238T323 1137T385 1013T440 864T485 688T514 485T526 251Q526 134 519 53Q472 -519 162 -860Q139 -885 119 -904T86 -936T71 -949H56Q43 -949 39 -947T34 -937Q88 -883 140 -813Q428 -430 428 251Q428 453 402 628T338 922T245 1146T145 1309T46 1425Q44 1427 42 1429T39 1433T36 1436L34 1438Z'%3e%3c/path%3e %3c/defs%3e %3cg stroke='currentColor' fill='currentColor' stroke-width='0' transform='matrix(1 0 0 -1 0 0)' aria-hidden='true'%3e %3cg transform='translate(167%2c0)'%3e %3cg transform='translate(-11%2c0)'%3e %3cg transform='translate(0%2c13)'%3e %3cuse xlink:href='%23E1-MJMATHI-70' x='0' y='0'%3e%3c/use%3e %3cg transform='translate(503%2c-150)'%3e %3cuse transform='scale(0.707)' xlink:href='%23E1-MJMATHI-44' x='0' y='0'%3e%3c/use%3e %3cuse transform='scale(0.707)' xlink:href='%23E1-MJMATHI-69' x='828' y='0'%3e%3c/use%3e %3c/g%3e %3cuse xlink:href='%23E1-MJMAIN-3D' x='1711' y='0'%3e%3c/use%3e %3cg transform='translate(2489%2c0)'%3e %3cg transform='translate(397%2c0)'%3e %3crect stroke='none' width='1167' height='60' x='0' y='220'%3e%3c/rect%3e %3cuse xlink:href='%23E1-MJMAIN-31' x='333' y='676'%3e%3c/use%3e %3cg transform='translate(60%2c-686)'%3e %3cuse xlink:href='%23E1-MJMATHI-74' x='0' y='0'%3e%3c/use%3e %3cuse transform='scale(0.707)' xlink:href='%23E1-MJMATHI-44' x='511' y='-213'%3e%3c/use%3e %3c/g%3e %3c/g%3e %3c/g%3e %3cg transform='translate(4175%2c0)'%3e %3cuse xlink:href='%23E1-MJSZ3-28'%3e%3c/use%3e %3cg transform='translate(736%2c0)'%3e %3cuse xlink:href='%23E1-MJSZ2-222B' x='0' y='0'%3e%3c/use%3e %3cg transform='translate(1060%2c1089)'%3e %3cuse transform='scale(0.707)' xlink:href='%23E1-MJMATHI-74' x='0' y='0'%3e%3c/use%3e %3cg transform='translate(255%2c-150)'%3e %3cuse transform='scale(0.574)' xlink:href='%23E1-MJMATHI-44' x='0' y='0'%3e%3c/use%3e %3cuse transform='scale(0.574)' xlink:href='%23E1-MJMAIN-30' x='828' y='0'%3e%3c/use%3e %3c/g%3e %3c/g%3e %3cuse transform='scale(0.707)' xlink:href='%23E1-MJMAIN-30' x='787' y='-1270'%3e%3c/use%3e %3c/g%3e %3cg transform='translate(3153%2c0)'%3e %3cuse xlink:href='%23E1-MJMATHI-70' x='0' y='0'%3e%3c/use%3e %3cuse transform='scale(0.707)' xlink:href='%23E1-MJMATHI-44' x='712' y='-213'%3e%3c/use%3e %3c/g%3e %3cuse xlink:href='%23E1-MJMATHI-64' x='4342' y='0'%3e%3c/use%3e %3cg transform='translate(4866%2c0)'%3e %3cuse xlink:href='%23E1-MJMATHI-74' x='0' y='0'%3e%3c/use%3e %3cuse transform='scale(0.707)' xlink:href='%23E1-MJMATHI-44' x='511' y='-213'%3e%3c/use%3e %3c/g%3e %3cuse xlink:href='%23E1-MJMAIN-2B' x='6135' y='0'%3e%3c/use%3e %3cg transform='translate(7136%2c0)'%3e %3cuse xlink:href='%23E1-MJSZ2-222B' x='0' y='0'%3e%3c/use%3e %3cg transform='translate(1060%2c1089)'%3e %3cuse transform='scale(0.707)' xlink:href='%23E1-MJMATHI-74' x='0' y='0'%3e%3c/use%3e %3cuse transform='scale(0.574)' xlink:href='%23E1-MJMATHI-44' x='445' y='-260'%3e%3c/use%3e %3c/g%3e %3cg transform='translate(556%2c-898)'%3e %3cuse transform='scale(0.707)' xlink:href='%23E1-MJMATHI-74' x='0' y='0'%3e%3c/use%3e %3cg transform='translate(255%2c-150)'%3e %3cuse transform='scale(0.574)' xlink:href='%23E1-MJMATHI-44' x='0' y='0'%3e%3c/use%3e %3cuse transform='scale(0.574)' xlink:href='%23E1-MJMAIN-30' x='828' y='0'%3e%3c/use%3e %3c/g%3e %3c/g%3e %3c/g%3e %3cg transform='translate(9266%2c0)'%3e %3cuse xlink:href='%23E1-MJMATHI-70' x='0' y='0'%3e%3c/use%3e %3cuse transform='scale(0.707)' xlink:href='%23E1-MJMATHI-44' x='712' y='-213'%3e%3c/use%3e %3c/g%3e %3cuse xlink:href='%23E1-MJMATHI-64' x='10455' y='0'%3e%3c/use%3e %3cg transform='translate(10978%2c0)'%3e %3cuse xlink:href='%23E1-MJMATHI-74' x='0' y='0'%3e%3c/use%3e %3cuse transform='scale(0.707)' xlink:href='%23E1-MJMATHI-44' x='511' y='-213'%3e%3c/use%3e %3c/g%3e %3cuse xlink:href='%23E1-MJSZ3-29' x='12026' y='-1'%3e%3c/use%3e %3c/g%3e %3c/g%3e %3c/g%3e %3c/g%3e %3c/g%3e %3c/svg%3e)
in the region tD <= tD0 we use the following power law approximation for skin <=0:
' aria-hidden='true'%3e %3cg transform='translate(167%2c0)'%3e %3cg transform='translate(-11%2c0)'%3e %3cg transform='translate(0%2c-117)'%3e %3cuse xlink:href='%23E1-MJMATHI-70' x='0' y='0'%3e%3c/use%3e %3cuse transform='scale(0.707)' xlink:href='%23E1-MJMATHI-44' x='712' y='-213'%3e%3c/use%3e %3cuse xlink:href='%23E1-MJMAIN-3D' x='1467' y='0'%3e%3c/use%3e %3cuse xlink:href='%23E1-MJMATHI-61' x='2523' y='0'%3e%3c/use%3e %3cg transform='translate(3052%2c0)'%3e %3cuse xlink:href='%23E1-MJMATHI-74' x='0' y='0'%3e%3c/use%3e %3cg transform='translate(361%2c521)'%3e %3cuse transform='scale(0.707)' xlink:href='%23E1-MJMAIN-31' x='0' y='0'%3e%3c/use%3e %3cuse transform='scale(0.707)' xlink:href='%23E1-MJMAIN-2F' x='500' y='0'%3e%3c/use%3e %3cuse transform='scale(0.707)' xlink:href='%23E1-MJMAIN-32' x='1001' y='0'%3e%3c/use%3e %3c/g%3e %3cuse transform='scale(0.707)' xlink:href='%23E1-MJMATHI-44' x='511' y='-452'%3e%3c/use%3e %3c/g%3e %3c/g%3e %3c/g%3e %3c/g%3e %3c/g%3e %3c/svg%3e)
' aria-hidden='true'%3e %3cg transform='translate(167%2c0)'%3e %3cg transform='translate(-11%2c0)'%3e %3cuse xlink:href='%23E1-MJSZ2-222B' x='0' y='0'%3e%3c/use%3e %3cg transform='translate(1060%2c1089)'%3e %3cuse transform='scale(0.707)' xlink:href='%23E1-MJMATHI-74' x='0' y='0'%3e%3c/use%3e %3cg transform='translate(255%2c-150)'%3e %3cuse transform='scale(0.574)' xlink:href='%23E1-MJMATHI-44' x='0' y='0'%3e%3c/use%3e %3cuse transform='scale(0.574)' xlink:href='%23E1-MJMAIN-30' x='828' y='0'%3e%3c/use%3e %3c/g%3e %3c/g%3e %3cuse transform='scale(0.707)' xlink:href='%23E1-MJMAIN-30' x='787' y='-1270'%3e%3c/use%3e %3cuse xlink:href='%23E1-MJMATHI-61' x='2416' y='0'%3e%3c/use%3e %3cg transform='translate(2946%2c0)'%3e %3cuse xlink:href='%23E1-MJMAIN-221A' x='0' y='53'%3e%3c/use%3e %3crect stroke='none' width='1047' height='60' x='833' y='794'%3e%3c/rect%3e %3cg transform='translate(833%2c0)'%3e %3cuse xlink:href='%23E1-MJMATHI-74' x='0' y='0'%3e%3c/use%3e %3cuse transform='scale(0.707)' xlink:href='%23E1-MJMATHI-44' x='511' y='-213'%3e%3c/use%3e %3c/g%3e %3c/g%3e %3cuse xlink:href='%23E1-MJMATHI-64' x='4827' y='0'%3e%3c/use%3e %3cg transform='translate(5350%2c0)'%3e %3cuse xlink:href='%23E1-MJMATHI-74' x='0' y='0'%3e%3c/use%3e %3cuse transform='scale(0.707)' xlink:href='%23E1-MJMATHI-44' x='511' y='-213'%3e%3c/use%3e %3c/g%3e %3cuse xlink:href='%23E1-MJMAIN-3D' x='6675' y='0'%3e%3c/use%3e %3cuse xlink:href='%23E1-MJMATHI-61' x='7732' y='0'%3e%3c/use%3e %3cg transform='translate(8261%2c0)'%3e %3cg transform='translate(120%2c0)'%3e %3crect stroke='none' width='620' height='60' x='0' y='220'%3e%3c/rect%3e %3cg transform='translate(60%2c819)'%3e %3cg%3e%3c/g%3e %3cuse xlink:href='%23E1-MJMAIN-32' x='0' y='0'%3e%3c/use%3e %3c/g%3e %3cg transform='translate(60%2c-880)'%3e %3cg%3e%3c/g%3e %3cuse xlink:href='%23E1-MJMAIN-33' x='0' y='0'%3e%3c/use%3e %3c/g%3e %3c/g%3e %3c/g%3e %3cg transform='translate(9122%2c0)'%3e %3cuse xlink:href='%23E1-MJMATHI-74' x='0' y='0'%3e%3c/use%3e %3cg transform='translate(361%2c-150)'%3e %3cuse transform='scale(0.707)' xlink:href='%23E1-MJMATHI-44' x='0' y='0'%3e%3c/use%3e %3cuse transform='scale(0.707)' xlink:href='%23E1-MJMAIN-30' x='828' y='0'%3e%3c/use%3e %3c/g%3e %3c/g%3e %3cg transform='translate(10523%2c0)'%3e %3cuse xlink:href='%23E1-MJSZ1-221A' x='0' y='-44'%3e%3c/use%3e %3crect stroke='none' width='1401' height='60' x='1000' y='747'%3e%3c/rect%3e %3cg transform='translate(1000%2c0)'%3e %3cuse xlink:href='%23E1-MJMATHI-74' x='0' y='0'%3e%3c/use%3e %3cg transform='translate(361%2c-150)'%3e %3cuse transform='scale(0.707)' xlink:href='%23E1-MJMATHI-44' x='0' y='0'%3e%3c/use%3e %3cuse transform='scale(0.707)' xlink:href='%23E1-MJMAIN-30' x='828' y='0'%3e%3c/use%3e %3c/g%3e %3c/g%3e %3c/g%3e %3cuse xlink:href='%23E1-MJMAIN-3D' x='13202' y='0'%3e%3c/use%3e %3cg transform='translate(13981%2c0)'%3e %3cg transform='translate(397%2c0)'%3e %3crect stroke='none' width='620' height='60' x='0' y='220'%3e%3c/rect%3e %3cg transform='translate(60%2c819)'%3e %3cg%3e%3c/g%3e %3cuse xlink:href='%23E1-MJMAIN-32' x='0' y='0'%3e%3c/use%3e %3c/g%3e %3cg transform='translate(60%2c-880)'%3e %3cg%3e%3c/g%3e %3cuse xlink:href='%23E1-MJMAIN-33' x='0' y='0'%3e%3c/use%3e %3c/g%3e %3c/g%3e %3c/g%3e %3cg transform='translate(15119%2c0)'%3e %3cuse xlink:href='%23E1-MJMATHI-74' x='0' y='0'%3e%3c/use%3e %3cg transform='translate(361%2c-150)'%3e %3cuse transform='scale(0.707)' xlink:href='%23E1-MJMATHI-44' x='0' y='0'%3e%3c/use%3e %3cuse transform='scale(0.707)' xlink:href='%23E1-MJMAIN-30' x='828' y='0'%3e%3c/use%3e %3c/g%3e %3c/g%3e %3cg transform='translate(16520%2c0)'%3e %3cuse xlink:href='%23E1-MJMATHI-70' x='0' y='0'%3e%3c/use%3e %3cg transform='translate(503%2c-150)'%3e %3cuse transform='scale(0.707)' xlink:href='%23E1-MJMATHI-44' x='0' y='0'%3e%3c/use%3e %3cuse transform='scale(0.707)' xlink:href='%23E1-MJMAIN-30' x='828' y='0'%3e%3c/use%3e %3c/g%3e %3c/g%3e %3c/g%3e %3c/g%3e %3c/g%3e %3c/svg%3e)
%5cend%7barray%7d%3c/title%3e %3cdefs aria-hidden='true'%3e %3cpath stroke-width='1' id='E1-MJMATHI-70' d='M23 287Q24 290 25 295T30 317T40 348T55 381T75 411T101 433T134 442Q209 442 230 378L240 387Q302 442 358 442Q423 442 460 395T497 281Q497 173 421 82T249 -10Q227 -10 210 -4Q199 1 187 11T168 28L161 36Q160 35 139 -51T118 -138Q118 -144 126 -145T163 -148H188Q194 -155 194 -157T191 -175Q188 -187 185 -190T172 -194Q170 -194 161 -194T127 -193T65 -192Q-5 -192 -24 -194H-32Q-39 -187 -39 -183Q-37 -156 -26 -148H-6Q28 -147 33 -136Q36 -130 94 103T155 350Q156 355 156 364Q156 405 131 405Q109 405 94 377T71 316T59 280Q57 278 43 278H29Q23 284 23 287ZM178 102Q200 26 252 26Q282 26 310 49T356 107Q374 141 392 215T411 325V331Q411 405 350 405Q339 405 328 402T306 393T286 380T269 365T254 350T243 336T235 326L232 322Q232 321 229 308T218 264T204 212Q178 106 178 102Z'%3e%3c/path%3e %3cpath stroke-width='1' id='E1-MJMATHI-44' d='M287 628Q287 635 230 637Q207 637 200 638T193 647Q193 655 197 667T204 682Q206 683 403 683Q570 682 590 682T630 676Q702 659 752 597T803 431Q803 275 696 151T444 3L430 1L236 0H125H72Q48 0 41 2T33 11Q33 13 36 25Q40 41 44 43T67 46Q94 46 127 49Q141 52 146 61Q149 65 218 339T287 628ZM703 469Q703 507 692 537T666 584T629 613T590 629T555 636Q553 636 541 636T512 636T479 637H436Q392 637 386 627Q384 623 313 339T242 52Q242 48 253 48T330 47Q335 47 349 47T373 46Q499 46 581 128Q617 164 640 212T683 339T703 469Z'%3e%3c/path%3e %3cpath stroke-width='1' id='E1-MJMATHI-69' d='M184 600Q184 624 203 642T247 661Q265 661 277 649T290 619Q290 596 270 577T226 557Q211 557 198 567T184 600ZM21 287Q21 295 30 318T54 369T98 420T158 442Q197 442 223 419T250 357Q250 340 236 301T196 196T154 83Q149 61 149 51Q149 26 166 26Q175 26 185 29T208 43T235 78T260 137Q263 149 265 151T282 153Q302 153 302 143Q302 135 293 112T268 61T223 11T161 -11Q129 -11 102 10T74 74Q74 91 79 106T122 220Q160 321 166 341T173 380Q173 404 156 404H154Q124 404 99 371T61 287Q60 286 59 284T58 281T56 279T53 278T49 278T41 278H27Q21 284 21 287Z'%3e%3c/path%3e %3cpath stroke-width='1' id='E1-MJMAIN-3D' d='M56 347Q56 360 70 367H707Q722 359 722 347Q722 336 708 328L390 327H72Q56 332 56 347ZM56 153Q56 168 72 173H708Q722 163 722 153Q722 140 707 133H70Q56 140 56 153Z'%3e%3c/path%3e %3cpath stroke-width='1' id='E1-MJMAIN-31' d='M213 578L200 573Q186 568 160 563T102 556H83V602H102Q149 604 189 617T245 641T273 663Q275 666 285 666Q294 666 302 660V361L303 61Q310 54 315 52T339 48T401 46H427V0H416Q395 3 257 3Q121 3 100 0H88V46H114Q136 46 152 46T177 47T193 50T201 52T207 57T213 61V578Z'%3e%3c/path%3e %3cpath stroke-width='1' id='E1-MJMATHI-74' d='M26 385Q19 392 19 395Q19 399 22 411T27 425Q29 430 36 430T87 431H140L159 511Q162 522 166 540T173 566T179 586T187 603T197 615T211 624T229 626Q247 625 254 615T261 596Q261 589 252 549T232 470L222 433Q222 431 272 431H323Q330 424 330 420Q330 398 317 385H210L174 240Q135 80 135 68Q135 26 162 26Q197 26 230 60T283 144Q285 150 288 151T303 153H307Q322 153 322 145Q322 142 319 133Q314 117 301 95T267 48T216 6T155 -11Q125 -11 98 4T59 56Q57 64 57 83V101L92 241Q127 382 128 383Q128 385 77 385H26Z'%3e%3c/path%3e %3cpath stroke-width='1' id='E1-MJMAIN-28' d='M94 250Q94 319 104 381T127 488T164 576T202 643T244 695T277 729T302 750H315H319Q333 750 333 741Q333 738 316 720T275 667T226 581T184 443T167 250T184 58T225 -81T274 -167T316 -220T333 -241Q333 -250 318 -250H315H302L274 -226Q180 -141 137 -14T94 250Z'%3e%3c/path%3e %3cpath stroke-width='1' id='E1-MJMAIN-33' d='M127 463Q100 463 85 480T69 524Q69 579 117 622T233 665Q268 665 277 664Q351 652 390 611T430 522Q430 470 396 421T302 350L299 348Q299 347 308 345T337 336T375 315Q457 262 457 175Q457 96 395 37T238 -22Q158 -22 100 21T42 130Q42 158 60 175T105 193Q133 193 151 175T169 130Q169 119 166 110T159 94T148 82T136 74T126 70T118 67L114 66Q165 21 238 21Q293 21 321 74Q338 107 338 175V195Q338 290 274 322Q259 328 213 329L171 330L168 332Q166 335 166 348Q166 366 174 366Q202 366 232 371Q266 376 294 413T322 525V533Q322 590 287 612Q265 626 240 626Q208 626 181 615T143 592T132 580H135Q138 579 143 578T153 573T165 566T175 555T183 540T186 520Q186 498 172 481T127 463Z'%3e%3c/path%3e %3cpath stroke-width='1' id='E1-MJMAIN-32' d='M109 429Q82 429 66 447T50 491Q50 562 103 614T235 666Q326 666 387 610T449 465Q449 422 429 383T381 315T301 241Q265 210 201 149L142 93L218 92Q375 92 385 97Q392 99 409 186V189H449V186Q448 183 436 95T421 3V0H50V19V31Q50 38 56 46T86 81Q115 113 136 137Q145 147 170 174T204 211T233 244T261 278T284 308T305 340T320 369T333 401T340 431T343 464Q343 527 309 573T212 619Q179 619 154 602T119 569T109 550Q109 549 114 549Q132 549 151 535T170 489Q170 464 154 447T109 429Z'%3e%3c/path%3e %3cpath stroke-width='1' id='E1-MJMAIN-30' d='M96 585Q152 666 249 666Q297 666 345 640T423 548Q460 465 460 320Q460 165 417 83Q397 41 362 16T301 -15T250 -22Q224 -22 198 -16T137 16T82 83Q39 165 39 320Q39 494 96 585ZM321 597Q291 629 250 629Q208 629 178 597Q153 571 145 525T137 333Q137 175 145 125T181 46Q209 16 250 16Q290 16 318 46Q347 76 354 130T362 333Q362 478 354 524T321 597Z'%3e%3c/path%3e %3cpath stroke-width='1' id='E1-MJMAIN-2B' d='M56 237T56 250T70 270H369V420L370 570Q380 583 389 583Q402 583 409 568V270H707Q722 262 722 250T707 230H409V-68Q401 -82 391 -82H389H387Q375 -82 369 -68V230H70Q56 237 56 250Z'%3e%3c/path%3e %3cpath stroke-width='1' id='E1-MJSZ2-222B' d='M114 -798Q132 -824 165 -824H167Q195 -824 223 -764T275 -600T320 -391T362 -164Q365 -143 367 -133Q439 292 523 655T645 1127Q651 1145 655 1157T672 1201T699 1257T733 1306T777 1346T828 1360Q884 1360 912 1325T944 1245Q944 1220 932 1205T909 1186T887 1183Q866 1183 849 1198T832 1239Q832 1287 885 1296L882 1300Q879 1303 874 1307T866 1313Q851 1323 833 1323Q819 1323 807 1311T775 1255T736 1139T689 936T633 628Q574 293 510 -5T410 -437T355 -629Q278 -862 165 -862Q125 -862 92 -831T55 -746Q55 -711 74 -698T112 -685Q133 -685 150 -700T167 -741Q167 -789 114 -798Z'%3e%3c/path%3e %3cpath stroke-width='1' id='E1-MJMATHI-64' d='M366 683Q367 683 438 688T511 694Q523 694 523 686Q523 679 450 384T375 83T374 68Q374 26 402 26Q411 27 422 35Q443 55 463 131Q469 151 473 152Q475 153 483 153H487H491Q506 153 506 145Q506 140 503 129Q490 79 473 48T445 8T417 -8Q409 -10 393 -10Q359 -10 336 5T306 36L300 51Q299 52 296 50Q294 48 292 46Q233 -10 172 -10Q117 -10 75 30T33 157Q33 205 53 255T101 341Q148 398 195 420T280 442Q336 442 364 400Q369 394 369 396Q370 400 396 505T424 616Q424 629 417 632T378 637H357Q351 643 351 645T353 664Q358 683 366 683ZM352 326Q329 405 277 405Q242 405 210 374T160 293Q131 214 119 129Q119 126 119 118T118 106Q118 61 136 44T179 26Q233 26 290 98L298 109L352 326Z'%3e%3c/path%3e %3cpath stroke-width='1' id='E1-MJMAIN-29' d='M60 749L64 750Q69 750 74 750H86L114 726Q208 641 251 514T294 250Q294 182 284 119T261 12T224 -76T186 -143T145 -194T113 -227T90 -246Q87 -249 86 -250H74Q66 -250 63 -250T58 -247T55 -238Q56 -237 66 -225Q221 -64 221 250T66 725Q56 737 55 738Q55 746 60 749Z'%3e%3c/path%3e %3cpath stroke-width='1' id='E1-MJSZ4-28' d='M758 -1237T758 -1240T752 -1249H736Q718 -1249 717 -1248Q711 -1245 672 -1199Q237 -706 237 251T672 1700Q697 1730 716 1749Q718 1750 735 1750H752Q758 1744 758 1741Q758 1737 740 1713T689 1644T619 1537T540 1380T463 1176Q348 802 348 251Q348 -242 441 -599T744 -1218Q758 -1237 758 -1240Z'%3e%3c/path%3e %3cpath stroke-width='1' id='E1-MJSZ4-29' d='M33 1741Q33 1750 51 1750H60H65Q73 1750 81 1743T119 1700Q554 1207 554 251Q554 -707 119 -1199Q76 -1250 66 -1250Q65 -1250 62 -1250T56 -1249Q55 -1249 53 -1249T49 -1250Q33 -1250 33 -1239Q33 -1236 50 -1214T98 -1150T163 -1052T238 -910T311 -727Q443 -335 443 251Q443 402 436 532T405 831T339 1142T224 1438T50 1716Q33 1737 33 1741Z'%3e%3c/path%3e %3c/defs%3e %3cg stroke='currentColor' fill='currentColor' stroke-width='0' transform='matrix(1 0 0 -1 0 0)' aria-hidden='true'%3e %3cg transform='translate(167%2c0)'%3e %3cg transform='translate(-11%2c0)'%3e %3cuse xlink:href='%23E1-MJMATHI-70' x='0' y='0'%3e%3c/use%3e %3cg transform='translate(503%2c-150)'%3e %3cuse transform='scale(0.707)' xlink:href='%23E1-MJMATHI-44' x='0' y='0'%3e%3c/use%3e %3cuse transform='scale(0.707)' xlink:href='%23E1-MJMATHI-69' x='828' y='0'%3e%3c/use%3e %3c/g%3e %3cuse xlink:href='%23E1-MJMAIN-3D' x='1711' y='0'%3e%3c/use%3e %3cg transform='translate(2489%2c0)'%3e %3cg transform='translate(397%2c0)'%3e %3crect stroke='none' width='1167' height='60' x='0' y='220'%3e%3c/rect%3e %3cuse xlink:href='%23E1-MJMAIN-31' x='333' y='676'%3e%3c/use%3e %3cg transform='translate(60%2c-686)'%3e %3cuse xlink:href='%23E1-MJMATHI-74' x='0' y='0'%3e%3c/use%3e %3cuse transform='scale(0.707)' xlink:href='%23E1-MJMATHI-44' x='511' y='-213'%3e%3c/use%3e %3c/g%3e %3c/g%3e %3c/g%3e %3cg transform='translate(4175%2c0)'%3e %3cuse xlink:href='%23E1-MJSZ4-28'%3e%3c/use%3e %3cg transform='translate(792%2c0)'%3e %3cg transform='translate(120%2c0)'%3e %3crect stroke='none' width='620' height='60' x='0' y='220'%3e%3c/rect%3e %3cg transform='translate(60%2c819)'%3e %3cg%3e%3c/g%3e %3cuse xlink:href='%23E1-MJMAIN-33' x='0' y='0'%3e%3c/use%3e %3c/g%3e %3cg transform='translate(60%2c-880)'%3e %3cg%3e%3c/g%3e %3cuse xlink:href='%23E1-MJMAIN-32' x='0' y='0'%3e%3c/use%3e %3c/g%3e %3c/g%3e %3c/g%3e %3cg transform='translate(1653%2c0)'%3e %3cuse xlink:href='%23E1-MJMATHI-70' x='0' y='0'%3e%3c/use%3e %3cg transform='translate(503%2c-150)'%3e %3cuse transform='scale(0.707)' xlink:href='%23E1-MJMATHI-44' x='0' y='0'%3e%3c/use%3e %3cuse transform='scale(0.707)' xlink:href='%23E1-MJMAIN-30' x='828' y='0'%3e%3c/use%3e %3c/g%3e %3c/g%3e %3cg transform='translate(3196%2c0)'%3e %3cuse xlink:href='%23E1-MJMATHI-74' x='0' y='0'%3e%3c/use%3e %3cg transform='translate(361%2c-150)'%3e %3cuse transform='scale(0.707)' xlink:href='%23E1-MJMATHI-44' x='0' y='0'%3e%3c/use%3e %3cuse transform='scale(0.707)' xlink:href='%23E1-MJMAIN-30' x='828' y='0'%3e%3c/use%3e %3c/g%3e %3c/g%3e %3cuse xlink:href='%23E1-MJMAIN-2B' x='4819' y='0'%3e%3c/use%3e %3cg transform='translate(5820%2c0)'%3e %3cuse xlink:href='%23E1-MJSZ2-222B' x='0' y='0'%3e%3c/use%3e %3cg transform='translate(1060%2c1089)'%3e %3cuse transform='scale(0.707)' xlink:href='%23E1-MJMATHI-74' x='0' y='0'%3e%3c/use%3e %3cuse transform='scale(0.574)' xlink:href='%23E1-MJMATHI-44' x='445' y='-260'%3e%3c/use%3e %3c/g%3e %3cg transform='translate(556%2c-898)'%3e %3cuse transform='scale(0.707)' xlink:href='%23E1-MJMATHI-74' x='0' y='0'%3e%3c/use%3e %3cg transform='translate(255%2c-150)'%3e %3cuse transform='scale(0.574)' xlink:href='%23E1-MJMATHI-44' x='0' y='0'%3e%3c/use%3e %3cuse transform='scale(0.574)' xlink:href='%23E1-MJMAIN-30' x='828' y='0'%3e%3c/use%3e %3c/g%3e %3c/g%3e %3c/g%3e %3cg transform='translate(7949%2c0)'%3e %3cuse xlink:href='%23E1-MJMATHI-70' x='0' y='0'%3e%3c/use%3e %3cuse transform='scale(0.707)' xlink:href='%23E1-MJMATHI-44' x='712' y='-213'%3e%3c/use%3e %3c/g%3e %3cuse xlink:href='%23E1-MJMATHI-64' x='9139' y='0'%3e%3c/use%3e %3cg transform='translate(9662%2c0)'%3e %3cuse xlink:href='%23E1-MJMATHI-74' x='0' y='0'%3e%3c/use%3e %3cuse transform='scale(0.707)' xlink:href='%23E1-MJMATHI-44' x='511' y='-213'%3e%3c/use%3e %3c/g%3e %3cuse xlink:href='%23E1-MJSZ4-29' x='10710' y='0'%3e%3c/use%3e %3c/g%3e %3c/g%3e %3c/g%3e %3c/g%3e %3c/svg%3e)
the NPI values for the data are calculated with the following equation, where the firs integral evaluated using the model curves.
%5cend%7barray%7d%3c/title%3e %3cdefs aria-hidden='true'%3e %3cpath stroke-width='1' id='E1-MJMATHI-70' d='M23 287Q24 290 25 295T30 317T40 348T55 381T75 411T101 433T134 442Q209 442 230 378L240 387Q302 442 358 442Q423 442 460 395T497 281Q497 173 421 82T249 -10Q227 -10 210 -4Q199 1 187 11T168 28L161 36Q160 35 139 -51T118 -138Q118 -144 126 -145T163 -148H188Q194 -155 194 -157T191 -175Q188 -187 185 -190T172 -194Q170 -194 161 -194T127 -193T65 -192Q-5 -192 -24 -194H-32Q-39 -187 -39 -183Q-37 -156 -26 -148H-6Q28 -147 33 -136Q36 -130 94 103T155 350Q156 355 156 364Q156 405 131 405Q109 405 94 377T71 316T59 280Q57 278 43 278H29Q23 284 23 287ZM178 102Q200 26 252 26Q282 26 310 49T356 107Q374 141 392 215T411 325V331Q411 405 350 405Q339 405 328 402T306 393T286 380T269 365T254 350T243 336T235 326L232 322Q232 321 229 308T218 264T204 212Q178 106 178 102Z'%3e%3c/path%3e %3cpath stroke-width='1' id='E1-MJMATHI-44' d='M287 628Q287 635 230 637Q207 637 200 638T193 647Q193 655 197 667T204 682Q206 683 403 683Q570 682 590 682T630 676Q702 659 752 597T803 431Q803 275 696 151T444 3L430 1L236 0H125H72Q48 0 41 2T33 11Q33 13 36 25Q40 41 44 43T67 46Q94 46 127 49Q141 52 146 61Q149 65 218 339T287 628ZM703 469Q703 507 692 537T666 584T629 613T590 629T555 636Q553 636 541 636T512 636T479 637H436Q392 637 386 627Q384 623 313 339T242 52Q242 48 253 48T330 47Q335 47 349 47T373 46Q499 46 581 128Q617 164 640 212T683 339T703 469Z'%3e%3c/path%3e %3cpath stroke-width='1' id='E1-MJMATHI-69' d='M184 600Q184 624 203 642T247 661Q265 661 277 649T290 619Q290 596 270 577T226 557Q211 557 198 567T184 600ZM21 287Q21 295 30 318T54 369T98 420T158 442Q197 442 223 419T250 357Q250 340 236 301T196 196T154 83Q149 61 149 51Q149 26 166 26Q175 26 185 29T208 43T235 78T260 137Q263 149 265 151T282 153Q302 153 302 143Q302 135 293 112T268 61T223 11T161 -11Q129 -11 102 10T74 74Q74 91 79 106T122 220Q160 321 166 341T173 380Q173 404 156 404H154Q124 404 99 371T61 287Q60 286 59 284T58 281T56 279T53 278T49 278T41 278H27Q21 284 21 287Z'%3e%3c/path%3e %3cpath stroke-width='1' id='E1-MJMAIN-3D' d='M56 347Q56 360 70 367H707Q722 359 722 347Q722 336 708 328L390 327H72Q56 332 56 347ZM56 153Q56 168 72 173H708Q722 163 722 153Q722 140 707 133H70Q56 140 56 153Z'%3e%3c/path%3e %3cpath stroke-width='1' id='E1-MJMAIN-31' d='M213 578L200 573Q186 568 160 563T102 556H83V602H102Q149 604 189 617T245 641T273 663Q275 666 285 666Q294 666 302 660V361L303 61Q310 54 315 52T339 48T401 46H427V0H416Q395 3 257 3Q121 3 100 0H88V46H114Q136 46 152 46T177 47T193 50T201 52T207 57T213 61V578Z'%3e%3c/path%3e %3cpath stroke-width='1' id='E1-MJMATHI-74' d='M26 385Q19 392 19 395Q19 399 22 411T27 425Q29 430 36 430T87 431H140L159 511Q162 522 166 540T173 566T179 586T187 603T197 615T211 624T229 626Q247 625 254 615T261 596Q261 589 252 549T232 470L222 433Q222 431 272 431H323Q330 424 330 420Q330 398 317 385H210L174 240Q135 80 135 68Q135 26 162 26Q197 26 230 60T283 144Q285 150 288 151T303 153H307Q322 153 322 145Q322 142 319 133Q314 117 301 95T267 48T216 6T155 -11Q125 -11 98 4T59 56Q57 64 57 83V101L92 241Q127 382 128 383Q128 385 77 385H26Z'%3e%3c/path%3e %3cpath stroke-width='1' id='E1-MJMAIN-28' d='M94 250Q94 319 104 381T127 488T164 576T202 643T244 695T277 729T302 750H315H319Q333 750 333 741Q333 738 316 720T275 667T226 581T184 443T167 250T184 58T225 -81T274 -167T316 -220T333 -241Q333 -250 318 -250H315H302L274 -226Q180 -141 137 -14T94 250Z'%3e%3c/path%3e %3cpath stroke-width='1' id='E1-MJMAIN-5B' d='M118 -250V750H255V710H158V-210H255V-250H118Z'%3e%3c/path%3e %3cpath stroke-width='1' id='E1-MJSZ2-222B' d='M114 -798Q132 -824 165 -824H167Q195 -824 223 -764T275 -600T320 -391T362 -164Q365 -143 367 -133Q439 292 523 655T645 1127Q651 1145 655 1157T672 1201T699 1257T733 1306T777 1346T828 1360Q884 1360 912 1325T944 1245Q944 1220 932 1205T909 1186T887 1183Q866 1183 849 1198T832 1239Q832 1287 885 1296L882 1300Q879 1303 874 1307T866 1313Q851 1323 833 1323Q819 1323 807 1311T775 1255T736 1139T689 936T633 628Q574 293 510 -5T410 -437T355 -629Q278 -862 165 -862Q125 -862 92 -831T55 -746Q55 -711 74 -698T112 -685Q133 -685 150 -700T167 -741Q167 -789 114 -798Z'%3e%3c/path%3e %3cpath stroke-width='1' id='E1-MJMAIN-30' d='M96 585Q152 666 249 666Q297 666 345 640T423 548Q460 465 460 320Q460 165 417 83Q397 41 362 16T301 -15T250 -22Q224 -22 198 -16T137 16T82 83Q39 165 39 320Q39 494 96 585ZM321 597Q291 629 250 629Q208 629 178 597Q153 571 145 525T137 333Q137 175 145 125T181 46Q209 16 250 16Q290 16 318 46Q347 76 354 130T362 333Q362 478 354 524T321 597Z'%3e%3c/path%3e %3cpath stroke-width='1' id='E1-MJMATHI-64' d='M366 683Q367 683 438 688T511 694Q523 694 523 686Q523 679 450 384T375 83T374 68Q374 26 402 26Q411 27 422 35Q443 55 463 131Q469 151 473 152Q475 153 483 153H487H491Q506 153 506 145Q506 140 503 129Q490 79 473 48T445 8T417 -8Q409 -10 393 -10Q359 -10 336 5T306 36L300 51Q299 52 296 50Q294 48 292 46Q233 -10 172 -10Q117 -10 75 30T33 157Q33 205 53 255T101 341Q148 398 195 420T280 442Q336 442 364 400Q369 394 369 396Q370 400 396 505T424 616Q424 629 417 632T378 637H357Q351 643 351 645T353 664Q358 683 366 683ZM352 326Q329 405 277 405Q242 405 210 374T160 293Q131 214 119 129Q119 126 119 118T118 106Q118 61 136 44T179 26Q233 26 290 98L298 109L352 326Z'%3e%3c/path%3e %3cpath stroke-width='1' id='E1-MJMAIN-5D' d='M22 710V750H159V-250H22V-210H119V710H22Z'%3e%3c/path%3e %3cpath stroke-width='1' id='E1-MJSZ3-5B' d='M247 -949V1450H516V1388H309V-887H516V-949H247Z'%3e%3c/path%3e %3cpath stroke-width='1' id='E1-MJSZ3-5D' d='M11 1388V1450H280V-949H11V-887H218V1388H11Z'%3e%3c/path%3e %3cpath stroke-width='1' id='E1-MJMATHI-6D' d='M21 287Q22 293 24 303T36 341T56 388T88 425T132 442T175 435T205 417T221 395T229 376L231 369Q231 367 232 367L243 378Q303 442 384 442Q401 442 415 440T441 433T460 423T475 411T485 398T493 385T497 373T500 364T502 357L510 367Q573 442 659 442Q713 442 746 415T780 336Q780 285 742 178T704 50Q705 36 709 31T724 26Q752 26 776 56T815 138Q818 149 821 151T837 153Q857 153 857 145Q857 144 853 130Q845 101 831 73T785 17T716 -10Q669 -10 648 17T627 73Q627 92 663 193T700 345Q700 404 656 404H651Q565 404 506 303L499 291L466 157Q433 26 428 16Q415 -11 385 -11Q372 -11 364 -4T353 8T350 18Q350 29 384 161L420 307Q423 322 423 345Q423 404 379 404H374Q288 404 229 303L222 291L189 157Q156 26 151 16Q138 -11 108 -11Q95 -11 87 -5T76 7T74 17Q74 30 112 181Q151 335 151 342Q154 357 154 369Q154 405 129 405Q107 405 92 377T69 316T57 280Q55 278 41 278H27Q21 284 21 287Z'%3e%3c/path%3e %3cpath stroke-width='1' id='E1-MJMATHI-6F' d='M201 -11Q126 -11 80 38T34 156Q34 221 64 279T146 380Q222 441 301 441Q333 441 341 440Q354 437 367 433T402 417T438 387T464 338T476 268Q476 161 390 75T201 -11ZM121 120Q121 70 147 48T206 26Q250 26 289 58T351 142Q360 163 374 216T388 308Q388 352 370 375Q346 405 306 405Q243 405 195 347Q158 303 140 230T121 120Z'%3e%3c/path%3e %3cpath stroke-width='1' id='E1-MJMATHI-65' d='M39 168Q39 225 58 272T107 350T174 402T244 433T307 442H310Q355 442 388 420T421 355Q421 265 310 237Q261 224 176 223Q139 223 138 221Q138 219 132 186T125 128Q125 81 146 54T209 26T302 45T394 111Q403 121 406 121Q410 121 419 112T429 98T420 82T390 55T344 24T281 -1T205 -11Q126 -11 83 42T39 168ZM373 353Q367 405 305 405Q272 405 244 391T199 357T170 316T154 280T149 261Q149 260 169 260Q282 260 327 284T373 353Z'%3e%3c/path%3e %3cpath stroke-width='1' id='E1-MJMATHI-6C' d='M117 59Q117 26 142 26Q179 26 205 131Q211 151 215 152Q217 153 225 153H229Q238 153 241 153T246 151T248 144Q247 138 245 128T234 90T214 43T183 6T137 -11Q101 -11 70 11T38 85Q38 97 39 102L104 360Q167 615 167 623Q167 626 166 628T162 632T157 634T149 635T141 636T132 637T122 637Q112 637 109 637T101 638T95 641T94 647Q94 649 96 661Q101 680 107 682T179 688Q194 689 213 690T243 693T254 694Q266 694 266 686Q266 675 193 386T118 83Q118 81 118 75T117 65V59Z'%3e%3c/path%3e %3cpath stroke-width='1' id='E1-MJMAIN-2B' d='M56 237T56 250T70 270H369V420L370 570Q380 583 389 583Q402 583 409 568V270H707Q722 262 722 250T707 230H409V-68Q401 -82 391 -82H389H387Q375 -82 369 -68V230H70Q56 237 56 250Z'%3e%3c/path%3e %3cpath stroke-width='1' id='E1-MJMAIN-29' d='M60 749L64 750Q69 750 74 750H86L114 726Q208 641 251 514T294 250Q294 182 284 119T261 12T224 -76T186 -143T145 -194T113 -227T90 -246Q87 -249 86 -250H74Q66 -250 63 -250T58 -247T55 -238Q56 -237 66 -225Q221 -64 221 250T66 725Q56 737 55 738Q55 746 60 749Z'%3e%3c/path%3e %3cpath stroke-width='1' id='E1-MJSZ3-28' d='M701 -940Q701 -943 695 -949H664Q662 -947 636 -922T591 -879T537 -818T475 -737T412 -636T350 -511T295 -362T250 -186T221 17T209 251Q209 962 573 1361Q596 1386 616 1405T649 1437T664 1450H695Q701 1444 701 1441Q701 1436 681 1415T629 1356T557 1261T476 1118T400 927T340 675T308 359Q306 321 306 250Q306 -139 400 -430T690 -924Q701 -936 701 -940Z'%3e%3c/path%3e %3cpath stroke-width='1' id='E1-MJSZ3-29' d='M34 1438Q34 1446 37 1448T50 1450H56H71Q73 1448 99 1423T144 1380T198 1319T260 1238T323 1137T385 1013T440 864T485 688T514 485T526 251Q526 134 519 53Q472 -519 162 -860Q139 -885 119 -904T86 -936T71 -949H56Q43 -949 39 -947T34 -937Q88 -883 140 -813Q428 -430 428 251Q428 453 402 628T338 922T245 1146T145 1309T46 1425Q44 1427 42 1429T39 1433T36 1436L34 1438Z'%3e%3c/path%3e %3c/defs%3e %3cg stroke='currentColor' fill='currentColor' stroke-width='0' transform='matrix(1 0 0 -1 0 0)' aria-hidden='true'%3e %3cg transform='translate(167%2c0)'%3e %3cg transform='translate(-11%2c0)'%3e %3cg transform='translate(0%2c13)'%3e %3cuse xlink:href='%23E1-MJMATHI-70' x='0' y='0'%3e%3c/use%3e %3cg transform='translate(503%2c-150)'%3e %3cuse transform='scale(0.707)' xlink:href='%23E1-MJMATHI-44' x='0' y='0'%3e%3c/use%3e %3cuse transform='scale(0.707)' xlink:href='%23E1-MJMATHI-69' x='828' y='0'%3e%3c/use%3e %3c/g%3e %3cuse xlink:href='%23E1-MJMAIN-3D' x='1711' y='0'%3e%3c/use%3e %3cg transform='translate(2489%2c0)'%3e %3cg transform='translate(397%2c0)'%3e %3crect stroke='none' width='1167' height='60' x='0' y='220'%3e%3c/rect%3e %3cuse xlink:href='%23E1-MJMAIN-31' x='333' y='676'%3e%3c/use%3e %3cg transform='translate(60%2c-686)'%3e %3cuse xlink:href='%23E1-MJMATHI-74' x='0' y='0'%3e%3c/use%3e %3cuse transform='scale(0.707)' xlink:href='%23E1-MJMATHI-44' x='511' y='-213'%3e%3c/use%3e %3c/g%3e %3c/g%3e %3c/g%3e %3cg transform='translate(4175%2c0)'%3e %3cuse xlink:href='%23E1-MJSZ3-28'%3e%3c/use%3e %3cg transform='translate(736%2c0)'%3e %3cuse xlink:href='%23E1-MJSZ3-5B'%3e%3c/use%3e %3cg transform='translate(528%2c0)'%3e %3cuse xlink:href='%23E1-MJSZ2-222B' x='0' y='0'%3e%3c/use%3e %3cg transform='translate(1060%2c1089)'%3e %3cuse transform='scale(0.707)' xlink:href='%23E1-MJMATHI-74' x='0' y='0'%3e%3c/use%3e %3cg transform='translate(255%2c-150)'%3e %3cuse transform='scale(0.574)' xlink:href='%23E1-MJMATHI-44' x='0' y='0'%3e%3c/use%3e %3cuse transform='scale(0.574)' xlink:href='%23E1-MJMAIN-30' x='828' y='0'%3e%3c/use%3e %3c/g%3e %3c/g%3e %3cuse transform='scale(0.707)' xlink:href='%23E1-MJMAIN-30' x='787' y='-1270'%3e%3c/use%3e %3c/g%3e %3cg transform='translate(2945%2c0)'%3e %3cuse xlink:href='%23E1-MJMATHI-70' x='0' y='0'%3e%3c/use%3e %3cuse transform='scale(0.707)' xlink:href='%23E1-MJMATHI-44' x='712' y='-213'%3e%3c/use%3e %3c/g%3e %3cuse xlink:href='%23E1-MJMATHI-64' x='4134' y='0'%3e%3c/use%3e %3cg transform='translate(4658%2c0)'%3e %3cuse xlink:href='%23E1-MJMATHI-74' x='0' y='0'%3e%3c/use%3e %3cuse transform='scale(0.707)' xlink:href='%23E1-MJMATHI-44' x='511' y='-213'%3e%3c/use%3e %3c/g%3e %3cuse xlink:href='%23E1-MJSZ3-5D' x='5705' y='-1'%3e%3c/use%3e %3cg transform='translate(6234%2c-986)'%3e %3cuse transform='scale(0.707)' xlink:href='%23E1-MJMATHI-6D' x='0' y='0'%3e%3c/use%3e %3cuse transform='scale(0.707)' xlink:href='%23E1-MJMATHI-6F' x='878' y='0'%3e%3c/use%3e %3cuse transform='scale(0.707)' xlink:href='%23E1-MJMATHI-64' x='1364' y='0'%3e%3c/use%3e %3cuse transform='scale(0.707)' xlink:href='%23E1-MJMATHI-65' x='1887' y='0'%3e%3c/use%3e %3cuse transform='scale(0.707)' xlink:href='%23E1-MJMATHI-6C' x='2354' y='0'%3e%3c/use%3e %3c/g%3e %3c/g%3e %3cuse xlink:href='%23E1-MJMAIN-2B' x='9168' y='0'%3e%3c/use%3e %3cg transform='translate(10169%2c0)'%3e %3cuse xlink:href='%23E1-MJSZ2-222B' x='0' y='0'%3e%3c/use%3e %3cg transform='translate(1060%2c1089)'%3e %3cuse transform='scale(0.707)' xlink:href='%23E1-MJMATHI-74' x='0' y='0'%3e%3c/use%3e %3cuse transform='scale(0.574)' xlink:href='%23E1-MJMATHI-44' x='445' y='-260'%3e%3c/use%3e %3c/g%3e %3cg transform='translate(556%2c-898)'%3e %3cuse transform='scale(0.707)' xlink:href='%23E1-MJMATHI-74' x='0' y='0'%3e%3c/use%3e %3cg transform='translate(255%2c-150)'%3e %3cuse transform='scale(0.574)' xlink:href='%23E1-MJMATHI-44' x='0' y='0'%3e%3c/use%3e %3cuse transform='scale(0.574)' xlink:href='%23E1-MJMAIN-30' x='828' y='0'%3e%3c/use%3e %3c/g%3e %3c/g%3e %3c/g%3e %3cg transform='translate(12298%2c0)'%3e %3cuse xlink:href='%23E1-MJMATHI-70' x='0' y='0'%3e%3c/use%3e %3cuse transform='scale(0.707)' xlink:href='%23E1-MJMATHI-44' x='712' y='-213'%3e%3c/use%3e %3c/g%3e %3cuse xlink:href='%23E1-MJMATHI-64' x='13488' y='0'%3e%3c/use%3e %3cg transform='translate(14011%2c0)'%3e %3cuse xlink:href='%23E1-MJMATHI-74' x='0' y='0'%3e%3c/use%3e %3cuse transform='scale(0.707)' xlink:href='%23E1-MJMATHI-44' x='511' y='-213'%3e%3c/use%3e %3c/g%3e %3cuse xlink:href='%23E1-MJSZ3-29' x='15058' y='-1'%3e%3c/use%3e %3c/g%3e %3c/g%3e %3c/g%3e %3c/g%3e %3c/g%3e %3c/svg%3e)
For skin > 0 we use the following approximation:
' aria-hidden='true'%3e %3cg transform='translate(167%2c0)'%3e %3cg transform='translate(-11%2c0)'%3e %3cg transform='translate(0%2c-50)'%3e %3cuse xlink:href='%23E1-MJMATHI-70' x='0' y='0'%3e%3c/use%3e %3cuse transform='scale(0.707)' xlink:href='%23E1-MJMATHI-44' x='712' y='-213'%3e%3c/use%3e %3cuse xlink:href='%23E1-MJMAIN-3D' x='1467' y='0'%3e%3c/use%3e %3cg transform='translate(2523%2c0)'%3e %3cuse xlink:href='%23E1-MJMATHI-70' x='0' y='0'%3e%3c/use%3e %3cg transform='translate(503%2c-150)'%3e %3cuse transform='scale(0.707)' xlink:href='%23E1-MJMATHI-44' x='0' y='0'%3e%3c/use%3e %3cuse transform='scale(0.707)' xlink:href='%23E1-MJMAIN-30' x='828' y='0'%3e%3c/use%3e %3c/g%3e %3c/g%3e %3c/g%3e %3c/g%3e %3c/g%3e %3c/g%3e %3c/svg%3e)
%5cend%7barray%7d%3c/title%3e %3cdefs aria-hidden='true'%3e %3cpath stroke-width='1' id='E1-MJMATHI-70' d='M23 287Q24 290 25 295T30 317T40 348T55 381T75 411T101 433T134 442Q209 442 230 378L240 387Q302 442 358 442Q423 442 460 395T497 281Q497 173 421 82T249 -10Q227 -10 210 -4Q199 1 187 11T168 28L161 36Q160 35 139 -51T118 -138Q118 -144 126 -145T163 -148H188Q194 -155 194 -157T191 -175Q188 -187 185 -190T172 -194Q170 -194 161 -194T127 -193T65 -192Q-5 -192 -24 -194H-32Q-39 -187 -39 -183Q-37 -156 -26 -148H-6Q28 -147 33 -136Q36 -130 94 103T155 350Q156 355 156 364Q156 405 131 405Q109 405 94 377T71 316T59 280Q57 278 43 278H29Q23 284 23 287ZM178 102Q200 26 252 26Q282 26 310 49T356 107Q374 141 392 215T411 325V331Q411 405 350 405Q339 405 328 402T306 393T286 380T269 365T254 350T243 336T235 326L232 322Q232 321 229 308T218 264T204 212Q178 106 178 102Z'%3e%3c/path%3e %3cpath stroke-width='1' id='E1-MJMATHI-44' d='M287 628Q287 635 230 637Q207 637 200 638T193 647Q193 655 197 667T204 682Q206 683 403 683Q570 682 590 682T630 676Q702 659 752 597T803 431Q803 275 696 151T444 3L430 1L236 0H125H72Q48 0 41 2T33 11Q33 13 36 25Q40 41 44 43T67 46Q94 46 127 49Q141 52 146 61Q149 65 218 339T287 628ZM703 469Q703 507 692 537T666 584T629 613T590 629T555 636Q553 636 541 636T512 636T479 637H436Q392 637 386 627Q384 623 313 339T242 52Q242 48 253 48T330 47Q335 47 349 47T373 46Q499 46 581 128Q617 164 640 212T683 339T703 469Z'%3e%3c/path%3e %3cpath stroke-width='1' id='E1-MJMATHI-69' d='M184 600Q184 624 203 642T247 661Q265 661 277 649T290 619Q290 596 270 577T226 557Q211 557 198 567T184 600ZM21 287Q21 295 30 318T54 369T98 420T158 442Q197 442 223 419T250 357Q250 340 236 301T196 196T154 83Q149 61 149 51Q149 26 166 26Q175 26 185 29T208 43T235 78T260 137Q263 149 265 151T282 153Q302 153 302 143Q302 135 293 112T268 61T223 11T161 -11Q129 -11 102 10T74 74Q74 91 79 106T122 220Q160 321 166 341T173 380Q173 404 156 404H154Q124 404 99 371T61 287Q60 286 59 284T58 281T56 279T53 278T49 278T41 278H27Q21 284 21 287Z'%3e%3c/path%3e %3cpath stroke-width='1' id='E1-MJMAIN-3D' d='M56 347Q56 360 70 367H707Q722 359 722 347Q722 336 708 328L390 327H72Q56 332 56 347ZM56 153Q56 168 72 173H708Q722 163 722 153Q722 140 707 133H70Q56 140 56 153Z'%3e%3c/path%3e %3cpath stroke-width='1' id='E1-MJMAIN-31' d='M213 578L200 573Q186 568 160 563T102 556H83V602H102Q149 604 189 617T245 641T273 663Q275 666 285 666Q294 666 302 660V361L303 61Q310 54 315 52T339 48T401 46H427V0H416Q395 3 257 3Q121 3 100 0H88V46H114Q136 46 152 46T177 47T193 50T201 52T207 57T213 61V578Z'%3e%3c/path%3e %3cpath stroke-width='1' id='E1-MJMATHI-74' d='M26 385Q19 392 19 395Q19 399 22 411T27 425Q29 430 36 430T87 431H140L159 511Q162 522 166 540T173 566T179 586T187 603T197 615T211 624T229 626Q247 625 254 615T261 596Q261 589 252 549T232 470L222 433Q222 431 272 431H323Q330 424 330 420Q330 398 317 385H210L174 240Q135 80 135 68Q135 26 162 26Q197 26 230 60T283 144Q285 150 288 151T303 153H307Q322 153 322 145Q322 142 319 133Q314 117 301 95T267 48T216 6T155 -11Q125 -11 98 4T59 56Q57 64 57 83V101L92 241Q127 382 128 383Q128 385 77 385H26Z'%3e%3c/path%3e %3cpath stroke-width='1' id='E1-MJMAIN-28' d='M94 250Q94 319 104 381T127 488T164 576T202 643T244 695T277 729T302 750H315H319Q333 750 333 741Q333 738 316 720T275 667T226 581T184 443T167 250T184 58T225 -81T274 -167T316 -220T333 -241Q333 -250 318 -250H315H302L274 -226Q180 -141 137 -14T94 250Z'%3e%3c/path%3e %3cpath stroke-width='1' id='E1-MJMAIN-30' d='M96 585Q152 666 249 666Q297 666 345 640T423 548Q460 465 460 320Q460 165 417 83Q397 41 362 16T301 -15T250 -22Q224 -22 198 -16T137 16T82 83Q39 165 39 320Q39 494 96 585ZM321 597Q291 629 250 629Q208 629 178 597Q153 571 145 525T137 333Q137 175 145 125T181 46Q209 16 250 16Q290 16 318 46Q347 76 354 130T362 333Q362 478 354 524T321 597Z'%3e%3c/path%3e %3cpath stroke-width='1' id='E1-MJMAIN-2B' d='M56 237T56 250T70 270H369V420L370 570Q380 583 389 583Q402 583 409 568V270H707Q722 262 722 250T707 230H409V-68Q401 -82 391 -82H389H387Q375 -82 369 -68V230H70Q56 237 56 250Z'%3e%3c/path%3e %3cpath stroke-width='1' id='E1-MJSZ2-222B' d='M114 -798Q132 -824 165 -824H167Q195 -824 223 -764T275 -600T320 -391T362 -164Q365 -143 367 -133Q439 292 523 655T645 1127Q651 1145 655 1157T672 1201T699 1257T733 1306T777 1346T828 1360Q884 1360 912 1325T944 1245Q944 1220 932 1205T909 1186T887 1183Q866 1183 849 1198T832 1239Q832 1287 885 1296L882 1300Q879 1303 874 1307T866 1313Q851 1323 833 1323Q819 1323 807 1311T775 1255T736 1139T689 936T633 628Q574 293 510 -5T410 -437T355 -629Q278 -862 165 -862Q125 -862 92 -831T55 -746Q55 -711 74 -698T112 -685Q133 -685 150 -700T167 -741Q167 -789 114 -798Z'%3e%3c/path%3e %3cpath stroke-width='1' id='E1-MJMATHI-64' d='M366 683Q367 683 438 688T511 694Q523 694 523 686Q523 679 450 384T375 83T374 68Q374 26 402 26Q411 27 422 35Q443 55 463 131Q469 151 473 152Q475 153 483 153H487H491Q506 153 506 145Q506 140 503 129Q490 79 473 48T445 8T417 -8Q409 -10 393 -10Q359 -10 336 5T306 36L300 51Q299 52 296 50Q294 48 292 46Q233 -10 172 -10Q117 -10 75 30T33 157Q33 205 53 255T101 341Q148 398 195 420T280 442Q336 442 364 400Q369 394 369 396Q370 400 396 505T424 616Q424 629 417 632T378 637H357Q351 643 351 645T353 664Q358 683 366 683ZM352 326Q329 405 277 405Q242 405 210 374T160 293Q131 214 119 129Q119 126 119 118T118 106Q118 61 136 44T179 26Q233 26 290 98L298 109L352 326Z'%3e%3c/path%3e %3cpath stroke-width='1' id='E1-MJMAIN-29' d='M60 749L64 750Q69 750 74 750H86L114 726Q208 641 251 514T294 250Q294 182 284 119T261 12T224 -76T186 -143T145 -194T113 -227T90 -246Q87 -249 86 -250H74Q66 -250 63 -250T58 -247T55 -238Q56 -237 66 -225Q221 -64 221 250T66 725Q56 737 55 738Q55 746 60 749Z'%3e%3c/path%3e %3cpath stroke-width='1' id='E1-MJSZ3-28' d='M701 -940Q701 -943 695 -949H664Q662 -947 636 -922T591 -879T537 -818T475 -737T412 -636T350 -511T295 -362T250 -186T221 17T209 251Q209 962 573 1361Q596 1386 616 1405T649 1437T664 1450H695Q701 1444 701 1441Q701 1436 681 1415T629 1356T557 1261T476 1118T400 927T340 675T308 359Q306 321 306 250Q306 -139 400 -430T690 -924Q701 -936 701 -940Z'%3e%3c/path%3e %3cpath stroke-width='1' id='E1-MJSZ3-29' d='M34 1438Q34 1446 37 1448T50 1450H56H71Q73 1448 99 1423T144 1380T198 1319T260 1238T323 1137T385 1013T440 864T485 688T514 485T526 251Q526 134 519 53Q472 -519 162 -860Q139 -885 119 -904T86 -936T71 -949H56Q43 -949 39 -947T34 -937Q88 -883 140 -813Q428 -430 428 251Q428 453 402 628T338 922T245 1146T145 1309T46 1425Q44 1427 42 1429T39 1433T36 1436L34 1438Z'%3e%3c/path%3e %3c/defs%3e %3cg stroke='currentColor' fill='currentColor' stroke-width='0' transform='matrix(1 0 0 -1 0 0)' aria-hidden='true'%3e %3cg transform='translate(167%2c0)'%3e %3cg transform='translate(-11%2c0)'%3e %3cg transform='translate(0%2c13)'%3e %3cuse xlink:href='%23E1-MJMATHI-70' x='0' y='0'%3e%3c/use%3e %3cg transform='translate(503%2c-150)'%3e %3cuse transform='scale(0.707)' xlink:href='%23E1-MJMATHI-44' x='0' y='0'%3e%3c/use%3e %3cuse transform='scale(0.707)' xlink:href='%23E1-MJMATHI-69' x='828' y='0'%3e%3c/use%3e %3c/g%3e %3cuse xlink:href='%23E1-MJMAIN-3D' x='1711' y='0'%3e%3c/use%3e %3cg transform='translate(2489%2c0)'%3e %3cg transform='translate(397%2c0)'%3e %3crect stroke='none' width='1167' height='60' x='0' y='220'%3e%3c/rect%3e %3cuse xlink:href='%23E1-MJMAIN-31' x='333' y='676'%3e%3c/use%3e %3cg transform='translate(60%2c-686)'%3e %3cuse xlink:href='%23E1-MJMATHI-74' x='0' y='0'%3e%3c/use%3e %3cuse transform='scale(0.707)' xlink:href='%23E1-MJMATHI-44' x='511' y='-213'%3e%3c/use%3e %3c/g%3e %3c/g%3e %3c/g%3e %3cg transform='translate(4175%2c0)'%3e %3cuse xlink:href='%23E1-MJSZ3-28'%3e%3c/use%3e %3cg transform='translate(736%2c0)'%3e %3cuse xlink:href='%23E1-MJMATHI-70' x='0' y='0'%3e%3c/use%3e %3cg transform='translate(503%2c-150)'%3e %3cuse transform='scale(0.707)' xlink:href='%23E1-MJMATHI-44' x='0' y='0'%3e%3c/use%3e %3cuse transform='scale(0.707)' xlink:href='%23E1-MJMAIN-30' x='828' y='0'%3e%3c/use%3e %3c/g%3e %3c/g%3e %3cg transform='translate(2279%2c0)'%3e %3cuse xlink:href='%23E1-MJMATHI-74' x='0' y='0'%3e%3c/use%3e %3cg transform='translate(361%2c-150)'%3e %3cuse transform='scale(0.707)' xlink:href='%23E1-MJMATHI-44' x='0' y='0'%3e%3c/use%3e %3cuse transform='scale(0.707)' xlink:href='%23E1-MJMAIN-30' x='828' y='0'%3e%3c/use%3e %3c/g%3e %3c/g%3e %3cuse xlink:href='%23E1-MJMAIN-2B' x='3903' y='0'%3e%3c/use%3e %3cg transform='translate(4903%2c0)'%3e %3cuse xlink:href='%23E1-MJSZ2-222B' x='0' y='0'%3e%3c/use%3e %3cg transform='translate(1060%2c1089)'%3e %3cuse transform='scale(0.707)' xlink:href='%23E1-MJMATHI-74' x='0' y='0'%3e%3c/use%3e %3cuse transform='scale(0.574)' xlink:href='%23E1-MJMATHI-44' x='445' y='-260'%3e%3c/use%3e %3c/g%3e %3cg transform='translate(556%2c-898)'%3e %3cuse transform='scale(0.707)' xlink:href='%23E1-MJMATHI-74' x='0' y='0'%3e%3c/use%3e %3cg transform='translate(255%2c-150)'%3e %3cuse transform='scale(0.574)' xlink:href='%23E1-MJMATHI-44' x='0' y='0'%3e%3c/use%3e %3cuse transform='scale(0.574)' xlink:href='%23E1-MJMAIN-30' x='828' y='0'%3e%3c/use%3e %3c/g%3e %3c/g%3e %3c/g%3e %3cg transform='translate(7033%2c0)'%3e %3cuse xlink:href='%23E1-MJMATHI-70' x='0' y='0'%3e%3c/use%3e %3cuse transform='scale(0.707)' xlink:href='%23E1-MJMATHI-44' x='712' y='-213'%3e%3c/use%3e %3c/g%3e %3cuse xlink:href='%23E1-MJMATHI-64' x='8222' y='0'%3e%3c/use%3e %3cg transform='translate(8746%2c0)'%3e %3cuse xlink:href='%23E1-MJMATHI-74' x='0' y='0'%3e%3c/use%3e %3cuse transform='scale(0.707)' xlink:href='%23E1-MJMATHI-44' x='511' y='-213'%3e%3c/use%3e %3c/g%3e %3cuse xlink:href='%23E1-MJSZ3-29' x='9793' y='-1'%3e%3c/use%3e %3c/g%3e %3c/g%3e %3c/g%3e %3c/g%3e %3c/g%3e %3c/svg%3e)
|
NPI derivative slope |
Flow Regime |
|---|---|
|
1/2 |
Linear |
|
0 |
Radial |
|
-1/2 |
Spherical |
|
1 |
Boundary-dominated (no flow boundary) |