
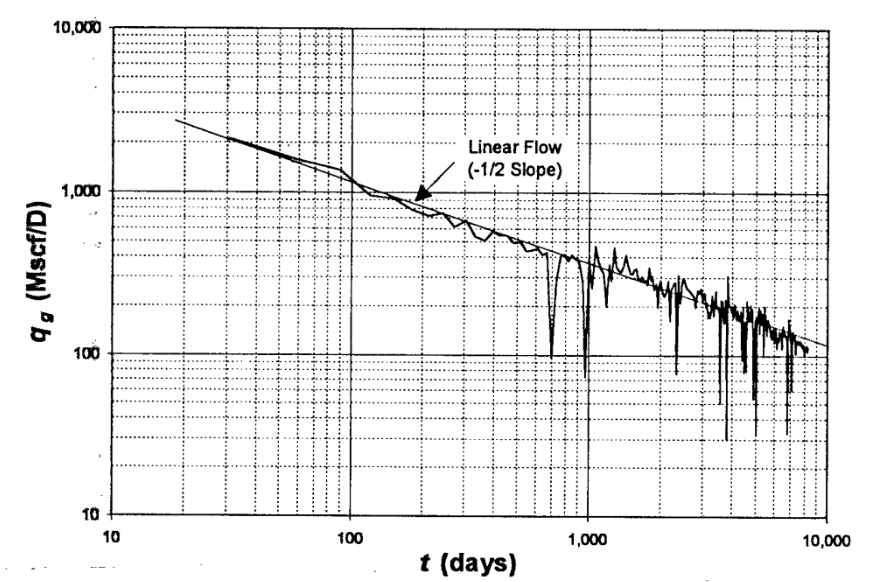
This example is from a tight gas well in a South Texas Field provided by Wattenbarger et al [1998], using monthly volumes. Although there were no recorded pressures in the early years, they assumed a constant flowing pressure.
The researchers believe log-log plot shows a half-slope for most of the wells life - despite a downward trend with the most recent data (at approximately 16 yrs, they believe PSS is not evident yet). If it was pseudo-radial flow in the latest data, the trend would be flatter as opposed to downward. See Also Hyperbolic (Arps) and Flow Regime Identification w/r to linear flow and Hyperbolic flow.
The authors believed they needed more data to confirm the reservoir size.
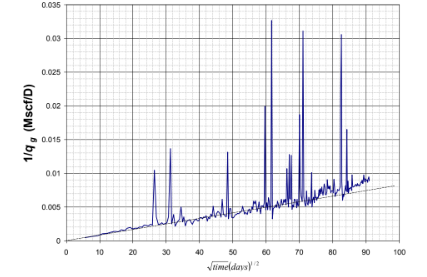
Another perhaps more useful plot is the square root plot, which dP or 1/q data is plotted versus t^(1/2). During linear flow, the data should follow a straight line. Using the same well, El-Banbi [1998] presented the following plot suggested that perhaps the late-time is the beginning of PSS.
References:
-
Wattenbarger et al, “Production Analysis in Linear Flow into Fractured Tight Gas Wells“, SPE 39931, Rocky Mountain Regional/Low Permeability Reservoirs Symposium & Exhibition, Denver Colorado, 5-8 April 1998.
-
El-Banb et al “Analysis of Linear Flow in a Gas Well Production“, SPE 39972, 1998 SPE Gas Technology Symposium in Calgary, Alberta, Canada