Introduction
AFA requires at least 1 Project and 1 Group to perform any analyses or simulation. Please refer to Create a Project and sub-topics if required.
STEP 1: Select MASLO autoRTA

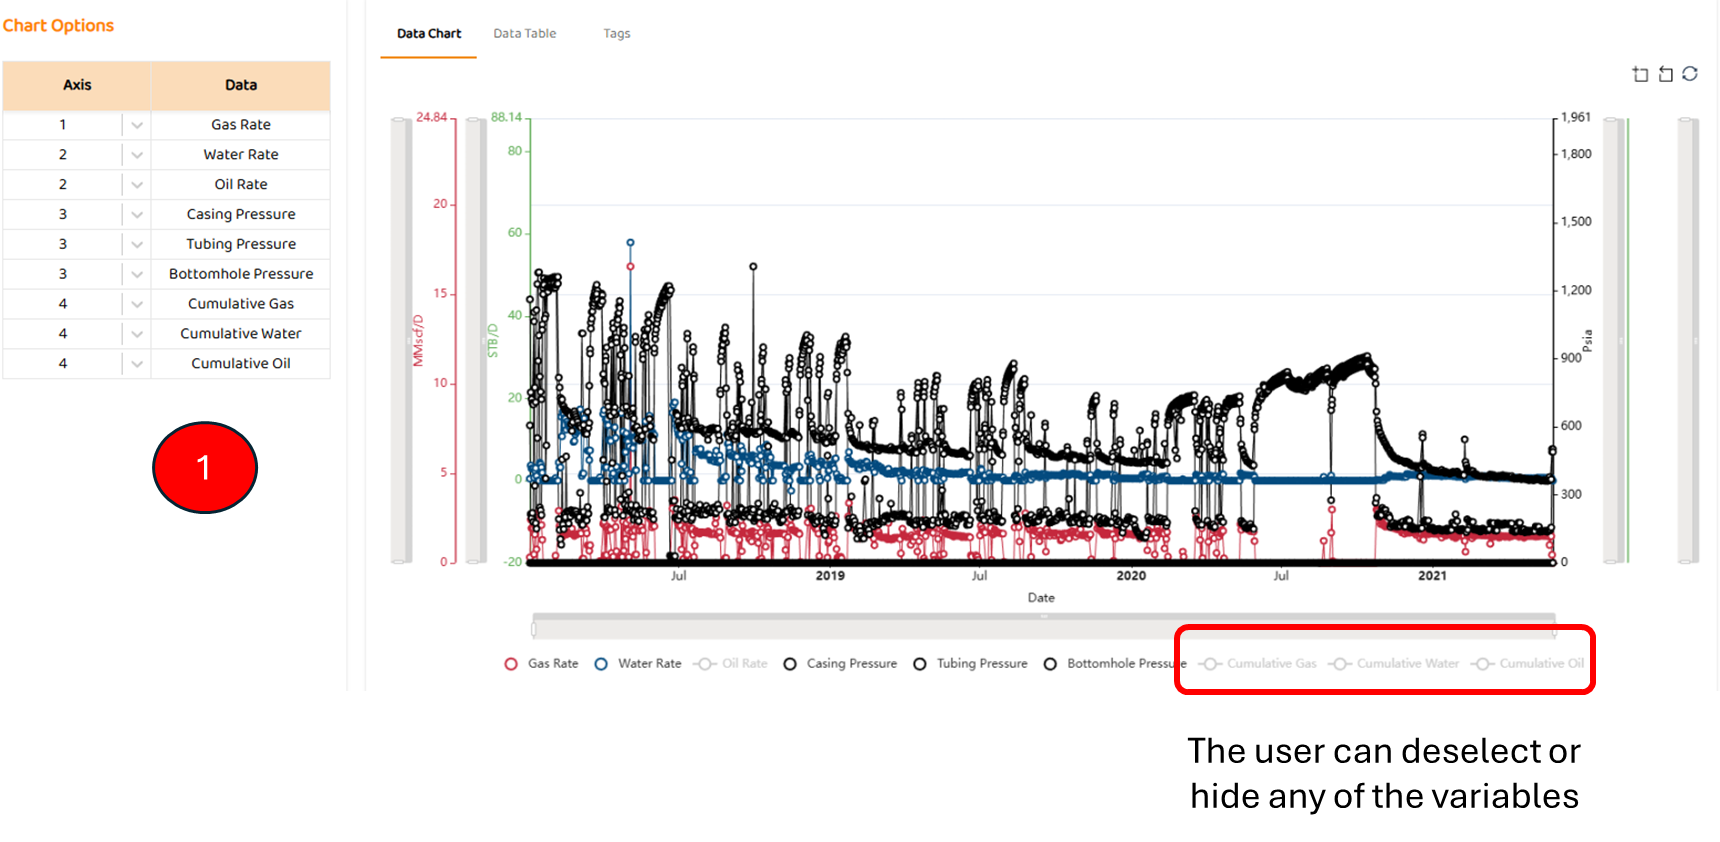
STEP 2: Data View
Data View is the first tab in most modules. It shows all the major data sources imported for this well (pressures, rates, etc). Some specific items are:
-
Options to select which axis a data set below (left or right)
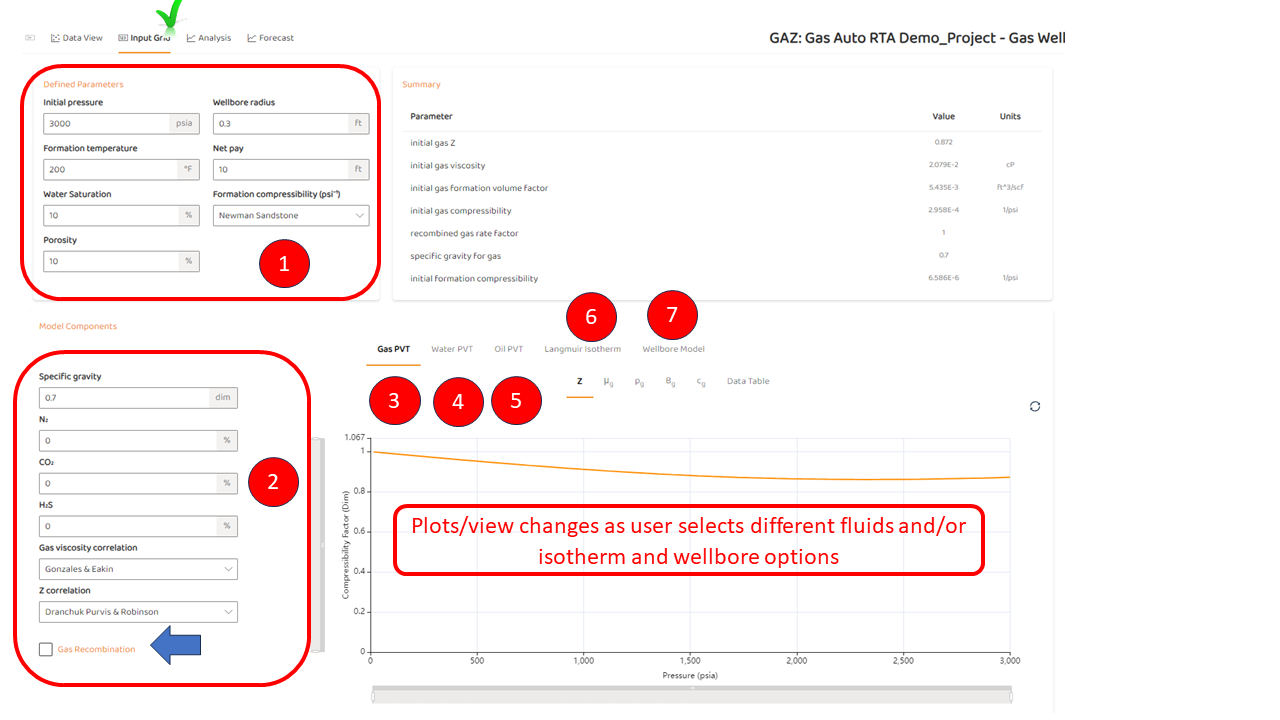
STEP 3: Input Grid
The user must specify all the PVT and rock properties shown below to proceed to the analysis or “FMB Output“ tab. On this tab, there are:
-
Defined Parameters
-
These are generally parameters given by the user including
-
-
PVT inputs and general PVT Correlations and Calculations including recombination calculations.
-
Gas PVT Plots - viscosity, density, z-factor etc
-
Water PVT Plots - viscosity, density, etc
-
Oil PVT Plots - viscosity, density, solution GOR, etc.
-
autoRTA: Langmuir Isotherm (not enabled for oil)
-
autoRTA: Wellbore Model (not enabled for oil)
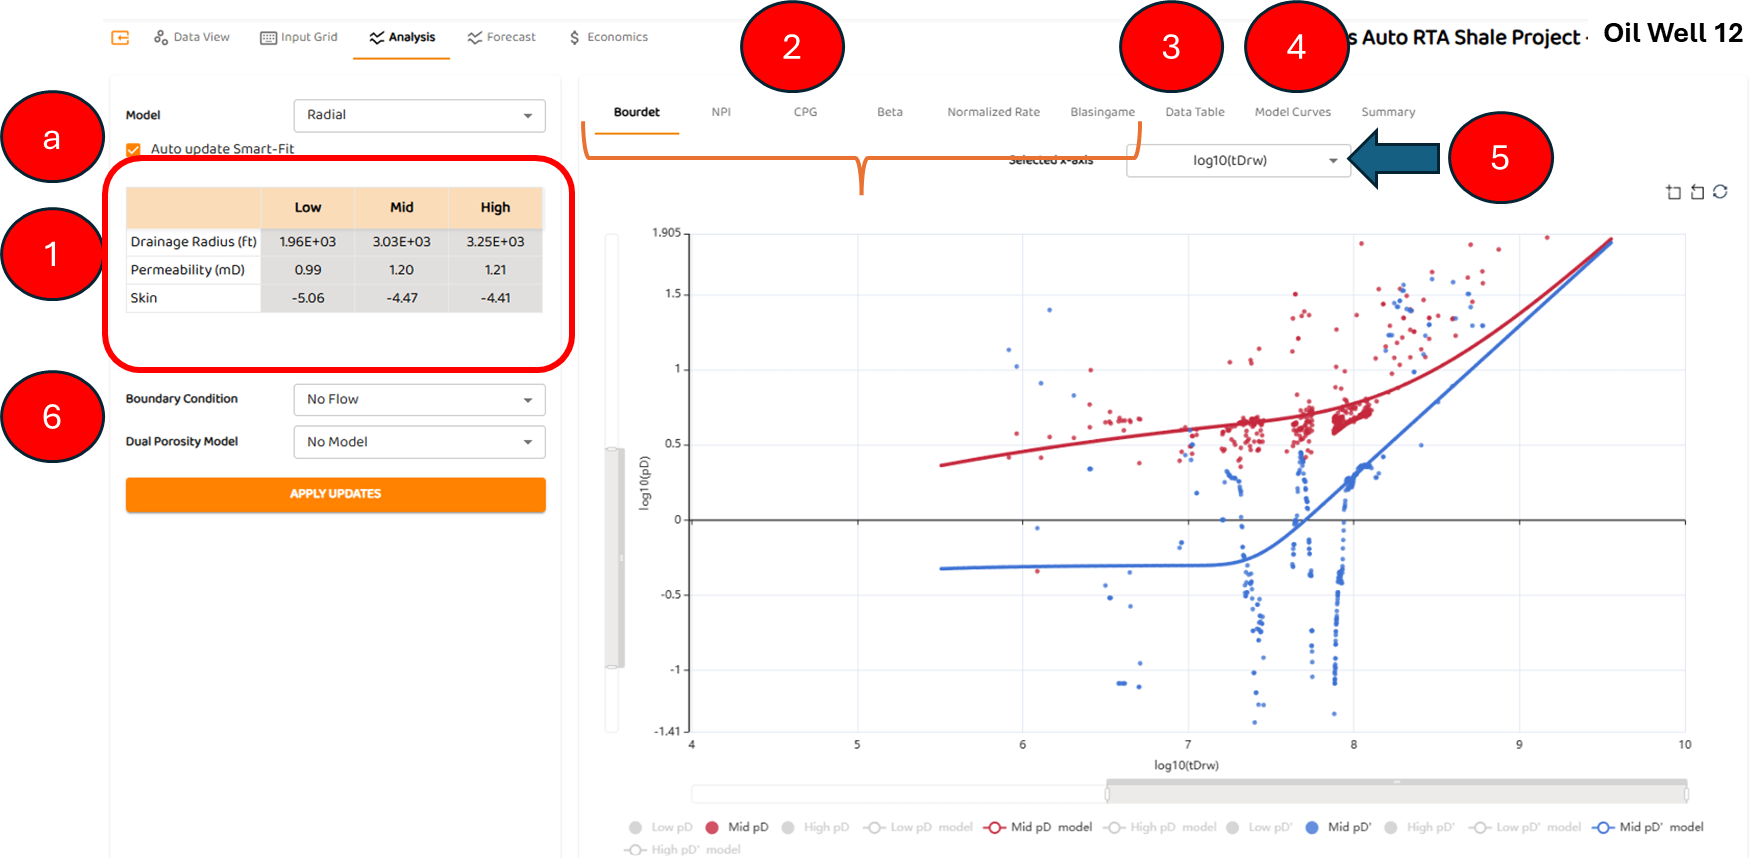
STEP 4: Analysis
Once the user clicks the analysis tab, after all appropriate inputs are completed, the following view is available. Key elements are:
-
Outputs from the automated Radial Analysis
-
If “Smart Fit“ is turned off, the user may select any model as they see fit, and perform a manual analysis.
-
-
Normalized Pressure Plots
-
Beta derivatives
-
Normalized Rate Plots
-
Blasingame Curves
-
Tabulated “Data Table“ of the results in the dimensionless form
-
Tabulated “Data Table“ of the base model curves
-
Adjustable Dimensionless Time Scale. Options available are:
-
tDrw
-
tDA
-
tDd
-
-
Manual Options such as Dual Porosity and Boundary Type.
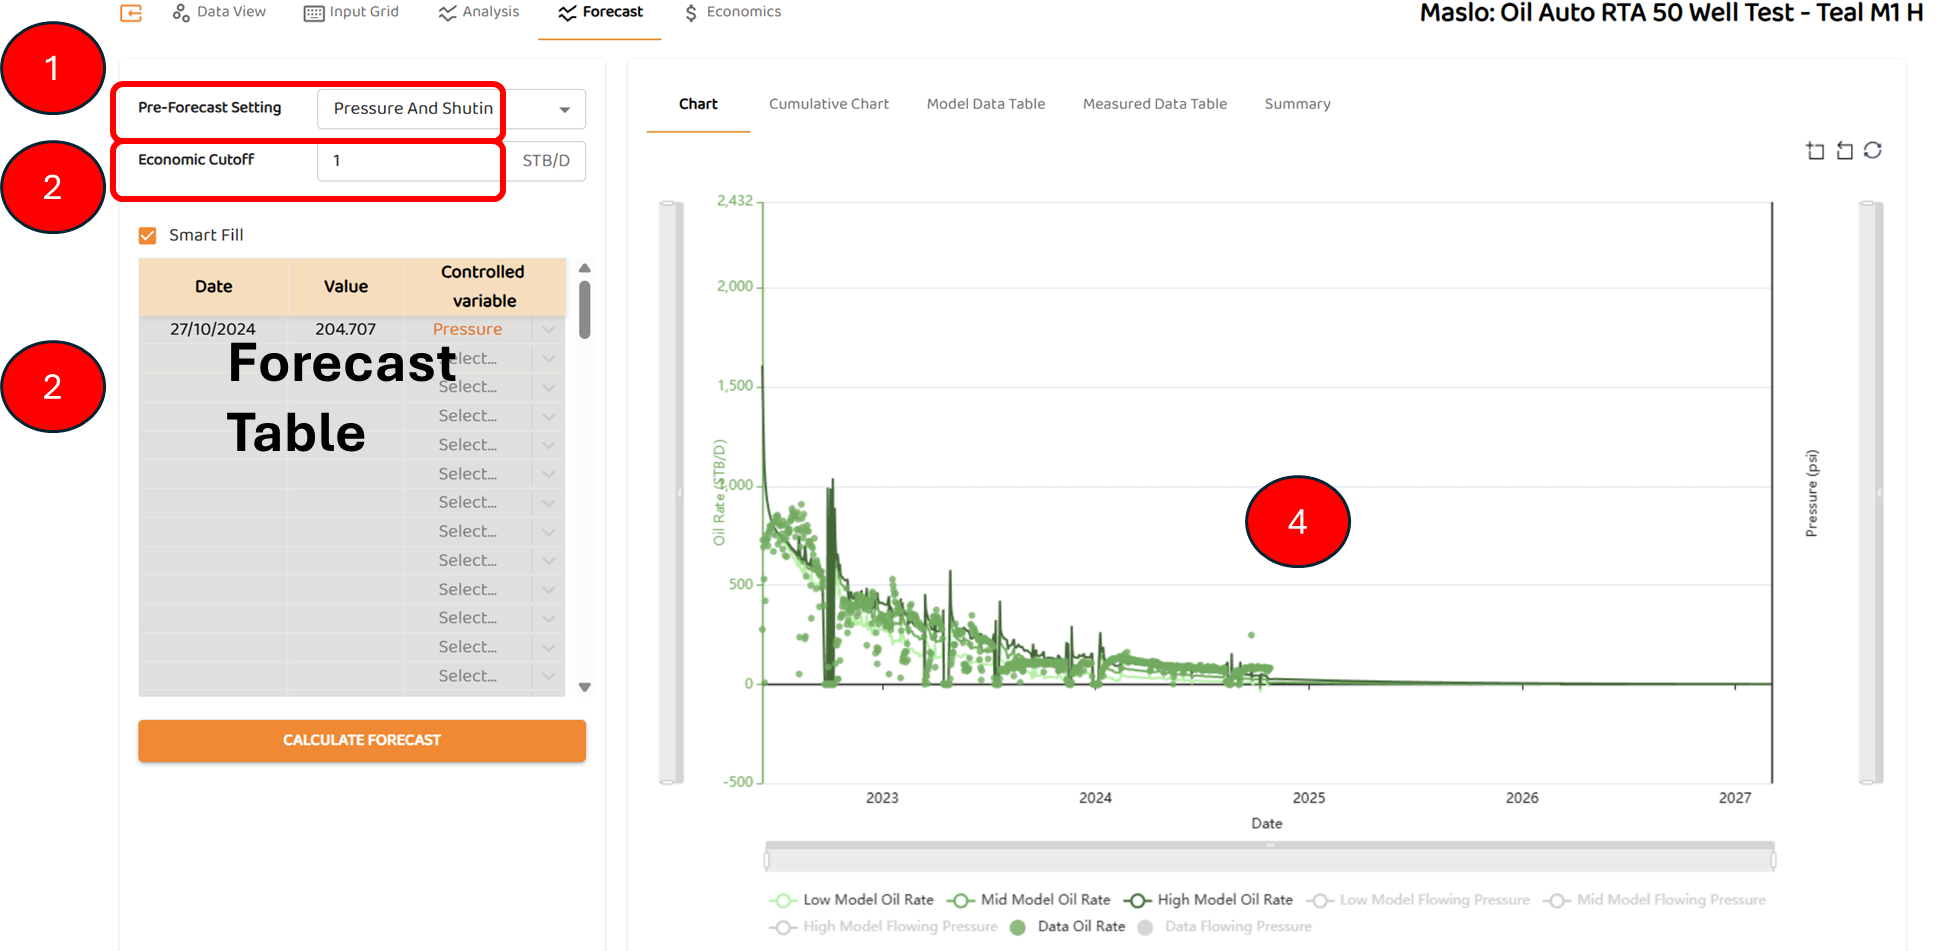
STEP 5: Forecast
When selecting the forecast tab, the results of the analysis and history match are shown. The basic elements are:
-
autoRTA Pre-Forecast Settingwhich gives options for the history match period.
-
Economic Cut-off
-
Forecast Table and Smart Fill which sets the forecast conditions beyond the history match
-
The history match and forecast periods
Also, note all three forecasts (low, mid, and high) from the automated analysis are shown below