
As shown in the image below, the user can add/remove forecasts from the plot by simply clicking on any of the name of the forecast (in the legend) below the plot.
Note, it is important to select the correct table when viewing decline parameters. That is, you can have OPS Forecast values displayed while the plot only shows Profile trends.
This procedure is the same regardless of oil or gas, or even any other module
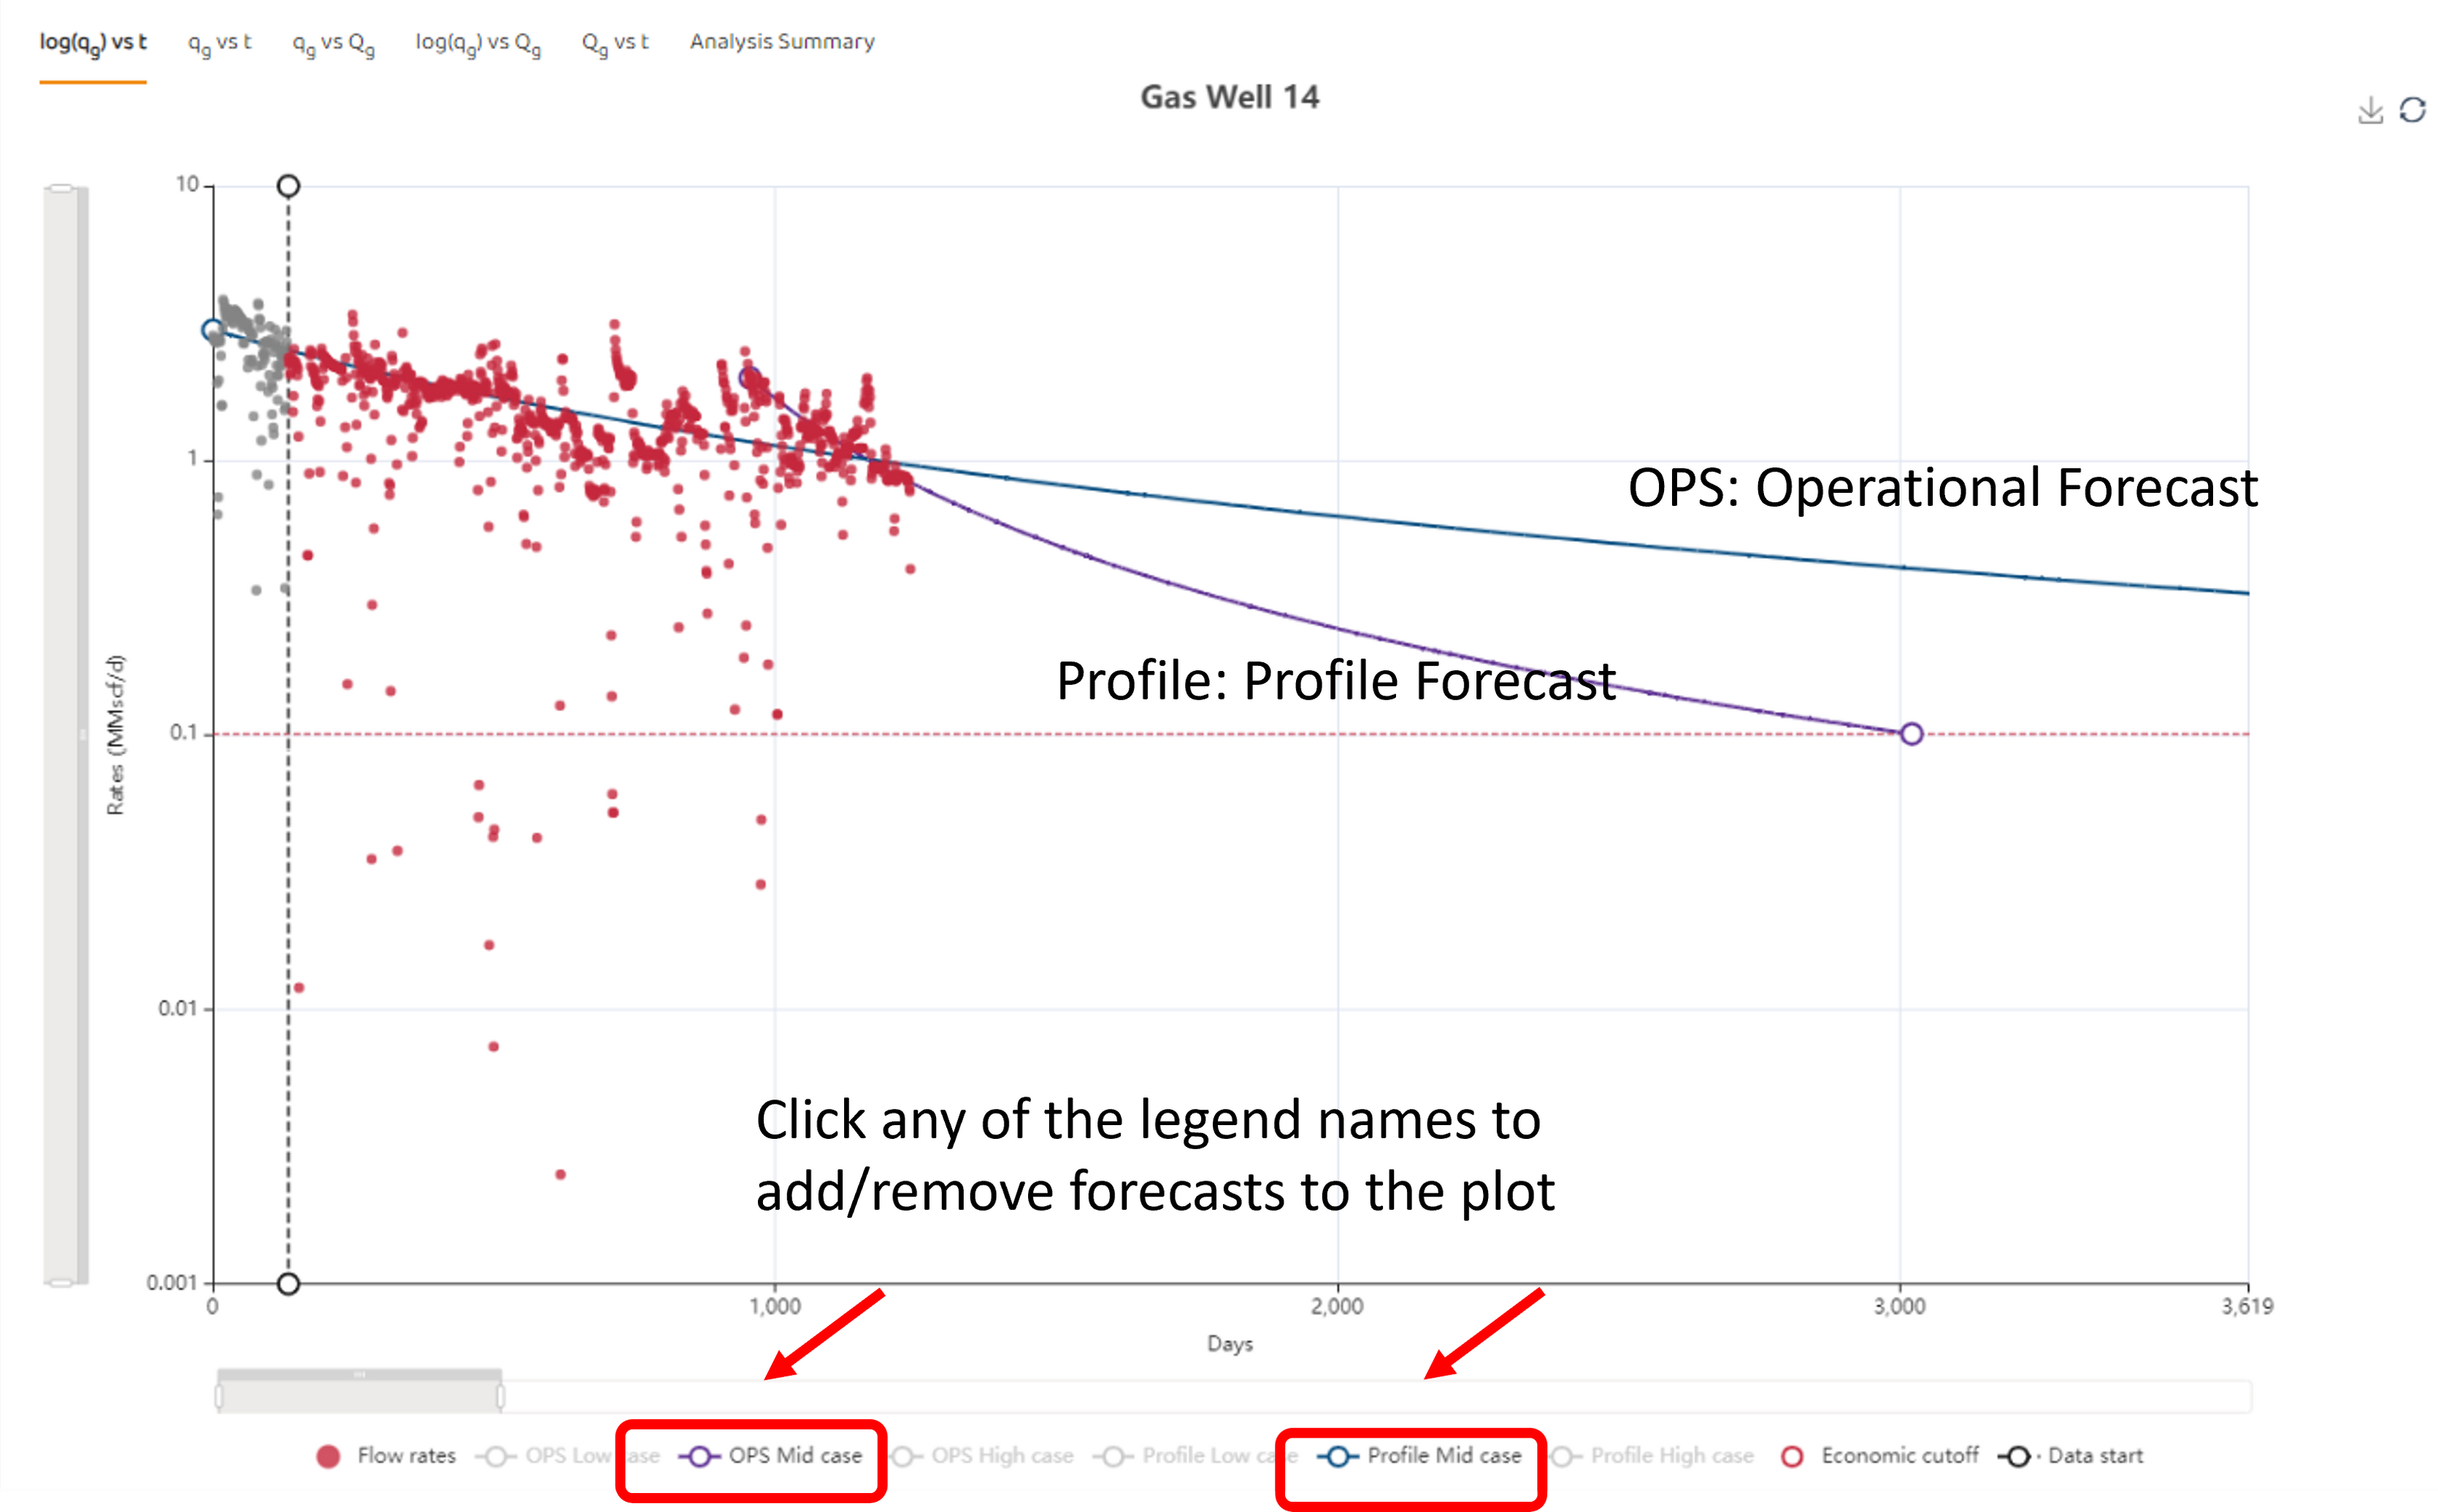
The procedure described above is generic to any module. Any data source or model listed on the lower legend can be clicked on or off.