Introduction
This module will also a user to perform decline for Gas Wells. The procedure and steps between SPAD: Gas Decline and SPAD: Oil Decline are identical.
AFA requires at least 1 Project and 1 Group to perform any analyses or simulation. Please refer to Create a Project and sub-topics if required.
Step 1: Select the SPAD Gas Decline
The gas decline module shown near the top of the AFA Grid.
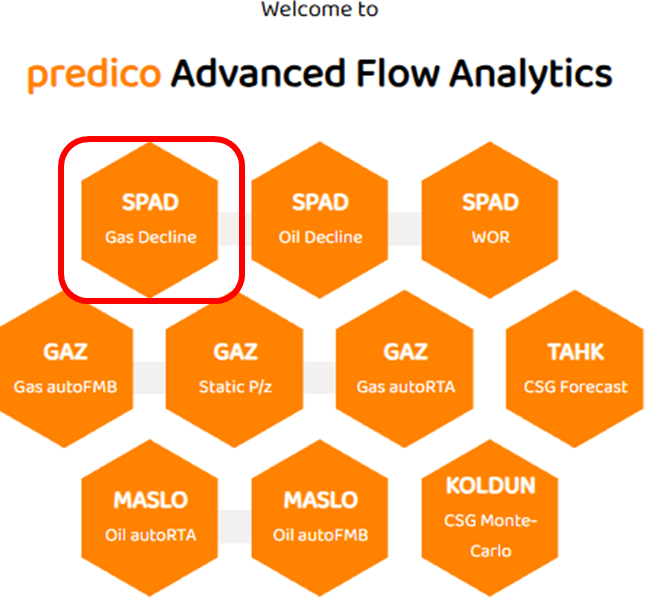
This module will only be enabled if your current well has gas rates (regardless if designated as gas or oil well etc).
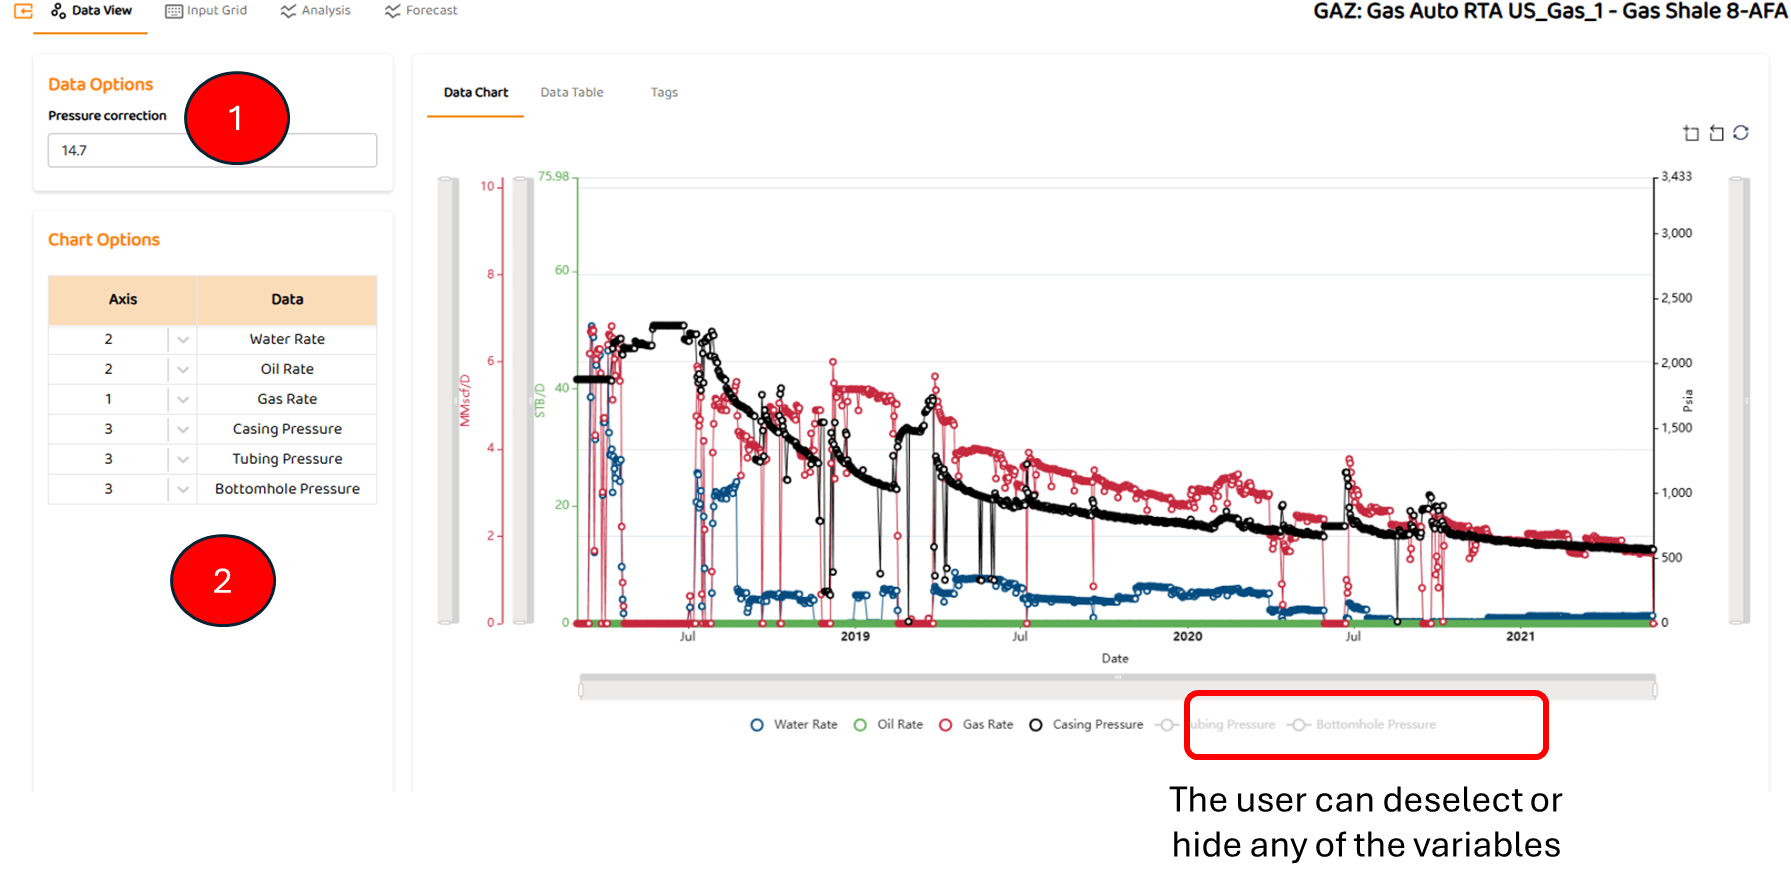
Step 2: Data View
Data View is the first tab in most modules. It shows all the major data sources imported for this well (pressures, rates, etc). Some specific items are:
-
Pressure Correction if desired. Can be zero.
-
Options to select which axis a data set below (left or right)
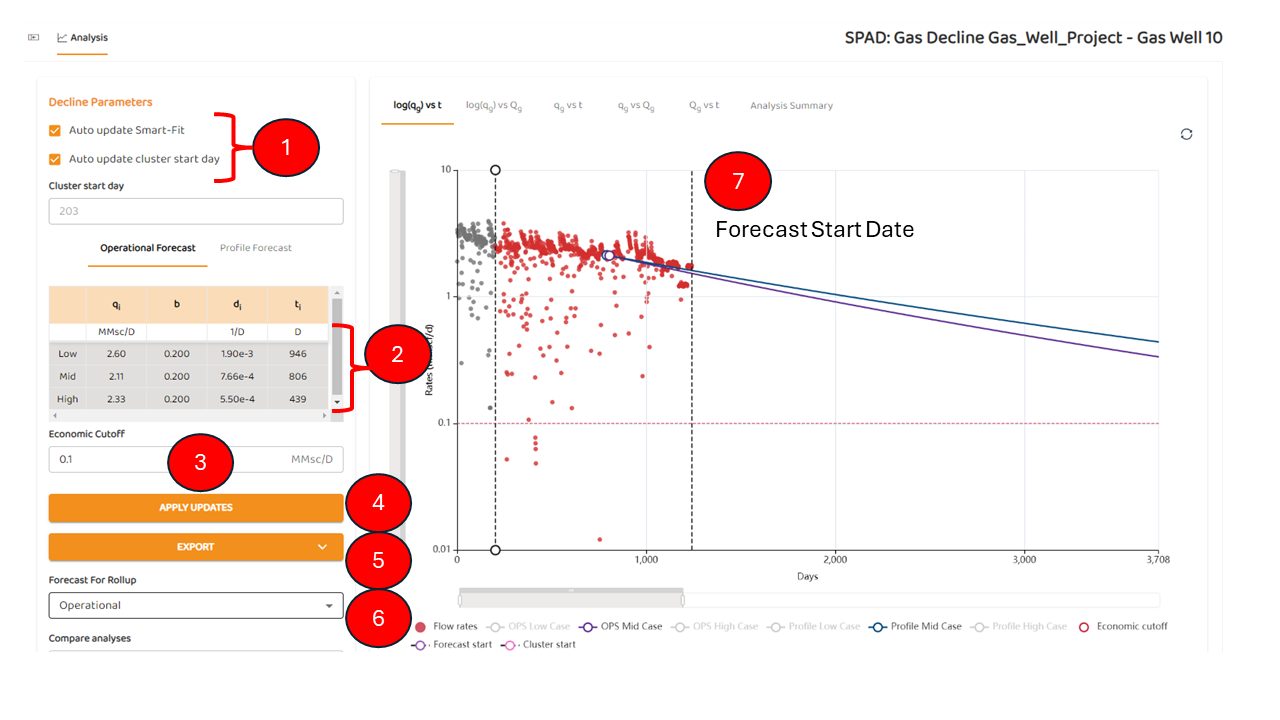
Step 3: Analysis Tab
After Data View, you will see teh analysis tab, where you will see a variety of options.
-
Smart Fit and Cluster Analysis options
-
Auto update Smart Fit: When enabled, the AFA analytics will generate the history match.
-
Auto update Cluster Start Day: When enabled, this option will use Unsupervised Cluster Analysis Option to remove early-time data such as clean-up, or perhaps transient flow.
-
Note: Manual adjustment of the decline lines are not possible when this option is enabled.
The automated analytics can be customized (I.e., maximum and minimum values of b set as discussed in Limiting "b" Values
-
Results Table show the results for both the Operational vs Profile Forecasts . The bolded title indicates which forecast results are being viewed.
-
The results table shows the calculated values from each decline
-
Low, mid, and high for the Profile Forecast (Profile).
-
Low, mid, and high for the Operational Forecast (OPS).
-
-
Note, the sub-tab shows the low, mid, and high cases (statistically, P10, P50, and P90). These values will change when the user switches between Operational vs Profile Forecasts
-
Refer to “Switching between Fore for additional detail.
-
-
Economic Cut-off: When generating a forecast, the forecast will terminate if the forecasted production rates fall below the economic cut-off
-
Apply Updates: All changes made to this page require the user to “APPLY UPDATES”. If you do not click this button, any changes will not be reflected in this forecast.
-
Export: This feature allows the user to send their results to an .CSV file
-
Forecast for Roll-up. When performing a roll-up (summation of forecasts from multiple wells) in the RULON: Roll-up, Group Runs, and Job-Queue module(s), the user must select if they prefer the operational or profile forecasts.
-
Forecast Start Date: This is the date at which the forecast starts, and unless set by the user in Set Forecast Start Date , it is assumed to be the end of the data.
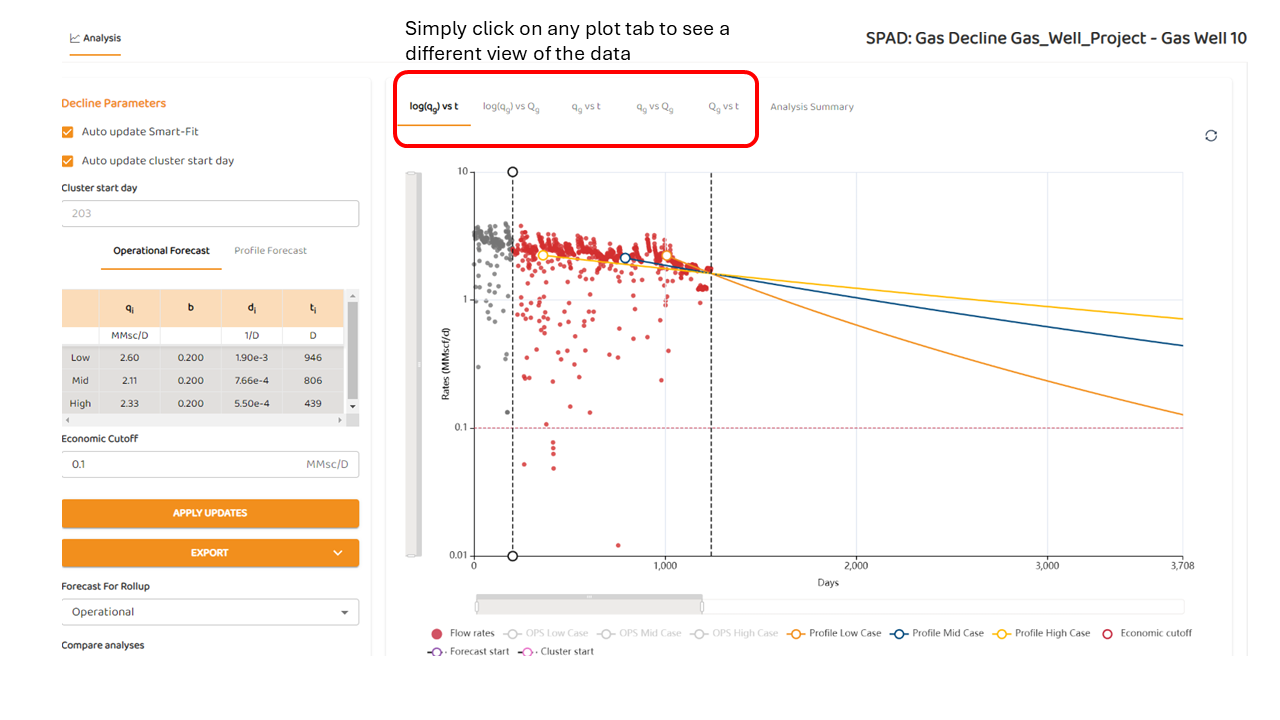
Step 4: Navigating the plots
To see the other plots, simply click on any plot tabs as shown below:
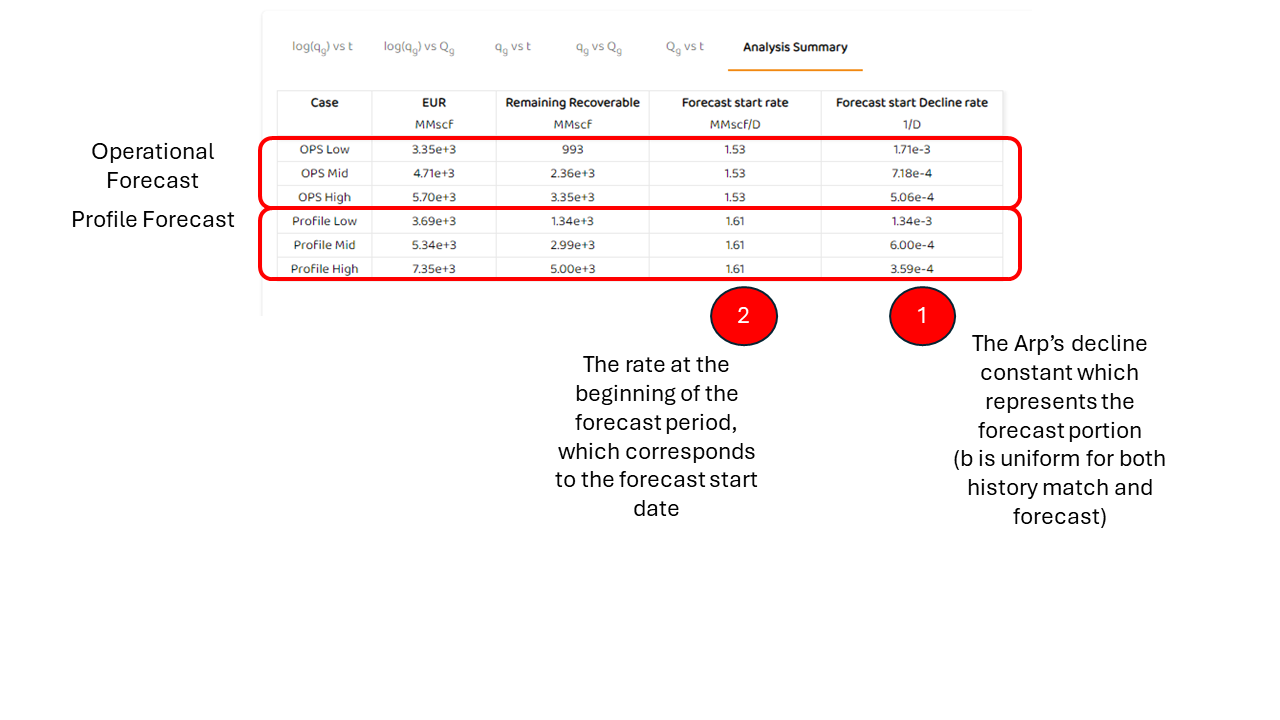
Step 5: Summary Tab
From the Analysis, described above in Step 3, you can select the “Analysis Summary“. This table will show detailed from about:
-
Expected Ultimate Recovery (EUR)
-
Remaining Recovery
-
Forecast Start Rate
-
Forecast Start Decline Rate
Refer to the image below: