
Introduction
Rate Transient Analysis: The science [and art] of combining rates and pressures.
The word Transient refers to the unsteady-state nature of fluid flow, and is defined as the fluid flowing condition at which the rate of change of pressure respect to time (at any position) is the reservoir is not constant, and greater than zero. In other words, not steady or pseudo-steady-state.
=f%5cleft(i%2ct%5cright)%5cend%7barray%7d%3c/title%3e %3cdefs aria-hidden='true'%3e %3cpath stroke-width='1' id='E1-MJMAIN-28' d='M94 250Q94 319 104 381T127 488T164 576T202 643T244 695T277 729T302 750H315H319Q333 750 333 741Q333 738 316 720T275 667T226 581T184 443T167 250T184 58T225 -81T274 -167T316 -220T333 -241Q333 -250 318 -250H315H302L274 -226Q180 -141 137 -14T94 250Z'%3e%3c/path%3e %3cpath stroke-width='1' id='E1-MJMAIN-2202' d='M202 508Q179 508 169 520T158 547Q158 557 164 577T185 624T230 675T301 710L333 715H345Q378 715 384 714Q447 703 489 661T549 568T566 457Q566 362 519 240T402 53Q321 -22 223 -22Q123 -22 73 56Q42 102 42 148V159Q42 276 129 370T322 465Q383 465 414 434T455 367L458 378Q478 461 478 515Q478 603 437 639T344 676Q266 676 223 612Q264 606 264 572Q264 547 246 528T202 508ZM430 306Q430 372 401 400T333 428Q270 428 222 382Q197 354 183 323T150 221Q132 149 132 116Q132 21 232 21Q244 21 250 22Q327 35 374 112Q389 137 409 196T430 306Z'%3e%3c/path%3e %3cpath stroke-width='1' id='E1-MJMATHI-70' d='M23 287Q24 290 25 295T30 317T40 348T55 381T75 411T101 433T134 442Q209 442 230 378L240 387Q302 442 358 442Q423 442 460 395T497 281Q497 173 421 82T249 -10Q227 -10 210 -4Q199 1 187 11T168 28L161 36Q160 35 139 -51T118 -138Q118 -144 126 -145T163 -148H188Q194 -155 194 -157T191 -175Q188 -187 185 -190T172 -194Q170 -194 161 -194T127 -193T65 -192Q-5 -192 -24 -194H-32Q-39 -187 -39 -183Q-37 -156 -26 -148H-6Q28 -147 33 -136Q36 -130 94 103T155 350Q156 355 156 364Q156 405 131 405Q109 405 94 377T71 316T59 280Q57 278 43 278H29Q23 284 23 287ZM178 102Q200 26 252 26Q282 26 310 49T356 107Q374 141 392 215T411 325V331Q411 405 350 405Q339 405 328 402T306 393T286 380T269 365T254 350T243 336T235 326L232 322Q232 321 229 308T218 264T204 212Q178 106 178 102Z'%3e%3c/path%3e %3cpath stroke-width='1' id='E1-MJMATHI-74' d='M26 385Q19 392 19 395Q19 399 22 411T27 425Q29 430 36 430T87 431H140L159 511Q162 522 166 540T173 566T179 586T187 603T197 615T211 624T229 626Q247 625 254 615T261 596Q261 589 252 549T232 470L222 433Q222 431 272 431H323Q330 424 330 420Q330 398 317 385H210L174 240Q135 80 135 68Q135 26 162 26Q197 26 230 60T283 144Q285 150 288 151T303 153H307Q322 153 322 145Q322 142 319 133Q314 117 301 95T267 48T216 6T155 -11Q125 -11 98 4T59 56Q57 64 57 83V101L92 241Q127 382 128 383Q128 385 77 385H26Z'%3e%3c/path%3e %3cpath stroke-width='1' id='E1-MJMAIN-29' d='M60 749L64 750Q69 750 74 750H86L114 726Q208 641 251 514T294 250Q294 182 284 119T261 12T224 -76T186 -143T145 -194T113 -227T90 -246Q87 -249 86 -250H74Q66 -250 63 -250T58 -247T55 -238Q56 -237 66 -225Q221 -64 221 250T66 725Q56 737 55 738Q55 746 60 749Z'%3e%3c/path%3e %3cpath stroke-width='1' id='E1-MJSZ3-28' d='M701 -940Q701 -943 695 -949H664Q662 -947 636 -922T591 -879T537 -818T475 -737T412 -636T350 -511T295 -362T250 -186T221 17T209 251Q209 962 573 1361Q596 1386 616 1405T649 1437T664 1450H695Q701 1444 701 1441Q701 1436 681 1415T629 1356T557 1261T476 1118T400 927T340 675T308 359Q306 321 306 250Q306 -139 400 -430T690 -924Q701 -936 701 -940Z'%3e%3c/path%3e %3cpath stroke-width='1' id='E1-MJSZ3-29' d='M34 1438Q34 1446 37 1448T50 1450H56H71Q73 1448 99 1423T144 1380T198 1319T260 1238T323 1137T385 1013T440 864T485 688T514 485T526 251Q526 134 519 53Q472 -519 162 -860Q139 -885 119 -904T86 -936T71 -949H56Q43 -949 39 -947T34 -937Q88 -883 140 -813Q428 -430 428 251Q428 453 402 628T338 922T245 1146T145 1309T46 1425Q44 1427 42 1429T39 1433T36 1436L34 1438Z'%3e%3c/path%3e %3cpath stroke-width='1' id='E1-MJMAIN-3D' d='M56 347Q56 360 70 367H707Q722 359 722 347Q722 336 708 328L390 327H72Q56 332 56 347ZM56 153Q56 168 72 173H708Q722 163 722 153Q722 140 707 133H70Q56 140 56 153Z'%3e%3c/path%3e %3cpath stroke-width='1' id='E1-MJMATHI-66' d='M118 -162Q120 -162 124 -164T135 -167T147 -168Q160 -168 171 -155T187 -126Q197 -99 221 27T267 267T289 382V385H242Q195 385 192 387Q188 390 188 397L195 425Q197 430 203 430T250 431Q298 431 298 432Q298 434 307 482T319 540Q356 705 465 705Q502 703 526 683T550 630Q550 594 529 578T487 561Q443 561 443 603Q443 622 454 636T478 657L487 662Q471 668 457 668Q445 668 434 658T419 630Q412 601 403 552T387 469T380 433Q380 431 435 431Q480 431 487 430T498 424Q499 420 496 407T491 391Q489 386 482 386T428 385H372L349 263Q301 15 282 -47Q255 -132 212 -173Q175 -205 139 -205Q107 -205 81 -186T55 -132Q55 -95 76 -78T118 -61Q162 -61 162 -103Q162 -122 151 -136T127 -157L118 -162Z'%3e%3c/path%3e %3cpath stroke-width='1' id='E1-MJMATHI-69' d='M184 600Q184 624 203 642T247 661Q265 661 277 649T290 619Q290 596 270 577T226 557Q211 557 198 567T184 600ZM21 287Q21 295 30 318T54 369T98 420T158 442Q197 442 223 419T250 357Q250 340 236 301T196 196T154 83Q149 61 149 51Q149 26 166 26Q175 26 185 29T208 43T235 78T260 137Q263 149 265 151T282 153Q302 153 302 143Q302 135 293 112T268 61T223 11T161 -11Q129 -11 102 10T74 74Q74 91 79 106T122 220Q160 321 166 341T173 380Q173 404 156 404H154Q124 404 99 371T61 287Q60 286 59 284T58 281T56 279T53 278T49 278T41 278H27Q21 284 21 287Z'%3e%3c/path%3e %3cpath stroke-width='1' id='E1-MJMAIN-2C' d='M78 35T78 60T94 103T137 121Q165 121 187 96T210 8Q210 -27 201 -60T180 -117T154 -158T130 -185T117 -194Q113 -194 104 -185T95 -172Q95 -168 106 -156T131 -126T157 -76T173 -3V9L172 8Q170 7 167 6T161 3T152 1T140 0Q113 0 96 17Z'%3e%3c/path%3e %3c/defs%3e %3cg stroke='currentColor' fill='currentColor' stroke-width='0' transform='matrix(1 0 0 -1 0 0)' aria-hidden='true'%3e %3cg transform='translate(167%2c0)'%3e %3cg transform='translate(-11%2c0)'%3e %3cuse xlink:href='%23E1-MJSZ3-28'%3e%3c/use%3e %3cg transform='translate(736%2c0)'%3e %3cg transform='translate(120%2c0)'%3e %3crect stroke='none' width='1191' height='60' x='0' y='220'%3e%3c/rect%3e %3cg transform='translate(60%2c714)'%3e %3cuse xlink:href='%23E1-MJMAIN-2202' x='0' y='0'%3e%3c/use%3e %3cuse xlink:href='%23E1-MJMATHI-70' x='567' y='0'%3e%3c/use%3e %3c/g%3e %3cg transform='translate(131%2c-736)'%3e %3cuse xlink:href='%23E1-MJMAIN-2202' x='0' y='0'%3e%3c/use%3e %3cuse xlink:href='%23E1-MJMATHI-74' x='567' y='0'%3e%3c/use%3e %3c/g%3e %3c/g%3e %3c/g%3e %3cuse xlink:href='%23E1-MJSZ3-29' x='2167' y='-1'%3e%3c/use%3e %3cuse xlink:href='%23E1-MJMAIN-3D' x='3181' y='0'%3e%3c/use%3e %3cuse xlink:href='%23E1-MJMATHI-66' x='4238' y='0'%3e%3c/use%3e %3cg transform='translate(4955%2c0)'%3e %3cuse xlink:href='%23E1-MJMAIN-28' x='0' y='0'%3e%3c/use%3e %3cuse xlink:href='%23E1-MJMATHI-69' x='389' y='0'%3e%3c/use%3e %3cuse xlink:href='%23E1-MJMAIN-2C' x='735' y='0'%3e%3c/use%3e %3cuse xlink:href='%23E1-MJMATHI-74' x='1180' y='0'%3e%3c/use%3e %3cuse xlink:href='%23E1-MJMAIN-29' x='1541' y='0'%3e%3c/use%3e %3c/g%3e %3c/g%3e %3c/g%3e %3c/g%3e %3c/svg%3e)
Rate Transient Analysis (or RTA) is a method for performance-based reservoir characterization during transient production period. According to Blasingame, these are model-based diagnostics for provide estimates of dynamic formation properties such as permeability, skin, fracture half-length, dual porosity/ natural fractures, and more - which of course can be used to provide a physics-based forecast.
RTA has its foundations in Pressure Transient Analysis (PTA). In Summary, RTA can provide:
-
Reserves - this is an estimate of the recoverable hydrocarbons, and is usually determined by traditional methods like decline (in addition to RTA methods).
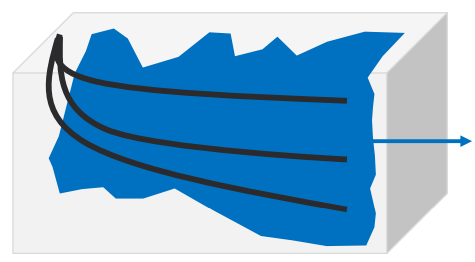
In RTA, the calculated volumes may be referred to as “Connected Volume“. There is a difference between the petrophysically mapped in-place volumes (the grey box) and the volume resolved by RTA (blue contacted volume)
-
Reservoir Characteristics - Permeability, well efficiency, and some reservoir characteristics can be obtained from RTA methods, which are an extension of PTA.
-
Oil / Gas-in-Place - The modern methods of production data analysis give OOIP and OGIP as opposed to regular EUR.
-
Production Forecasting - Calibrating models for rate and/or pressure prediction.
-
Completion effectiveness & frac optimization
-
Drawdown management and related production optimization
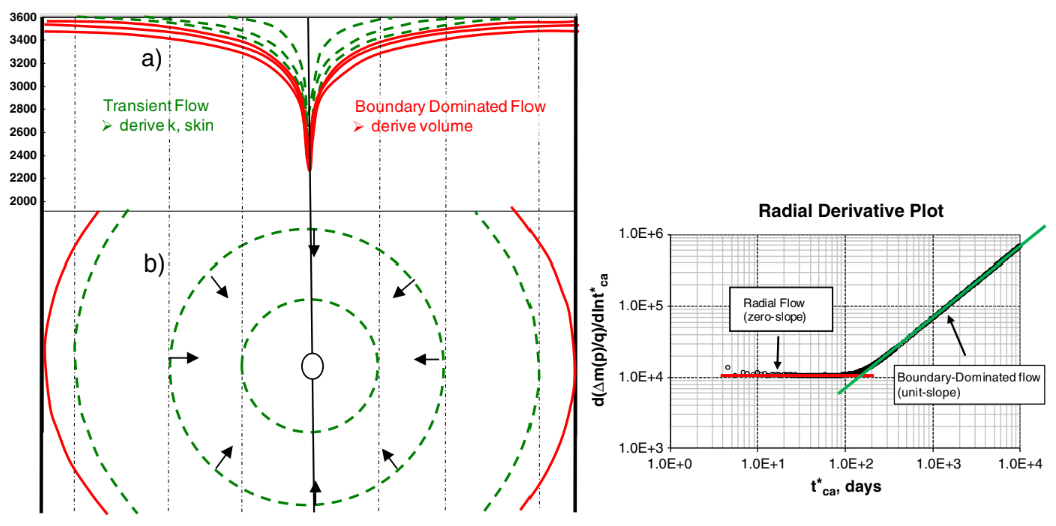
The figure below, provided by Clarkson [2013] illustrates the difference between transient flow, and pseudo-steady-state. The simulated pressures were done using a vertical well in dry gas homogeneous reservoir, producing against a constant flowing pressure. The derivative, shown to the right, was calculated using the Bourdet (Well Testing) derivative.
The upper left side of the image illustrates pressures in cross-section, while the lower left side shows isobars in plan view. During transient flow, shown in green dashed curves, the pressure propagates radially away from the well - it is this time period that one can interpret permeability and skin. During boundary dominated flow (red solid lines), the pressure drops at the same rate everywhere in the reservoir, and material-balance-like calculations can be performed to interpret the wellbore pressure drop for hydrocarbon-in-place.
RTA vs PTA
Both PTA and RTA have their own limitations and assumptions in analysis. PTA involves the analysis of pressure data of few hours or days, while RTA involve the analysis of production rate data of few months or years.
PTA could give detailed information about the reservoir properties near the wellbore (whatever region was investigated during this period). Test durations are in the range of hours to days and weeks.
On the other hand, RTA could only give an average information of the reservoir properties over a certain period of time and potentially better estimates resource size. Test durations are always increasing from weeks to months, and years.
In concept:
|
|
|
|---|---|
|
RTA |
Bulk evaluation of reservoir property (average to low diagnostic capability). Better suited for resource estimates |
|
PTA |
Higher resolution of permeability and/or skin estimates. High diagnostic capability. PTA requires a well to be shut-in |
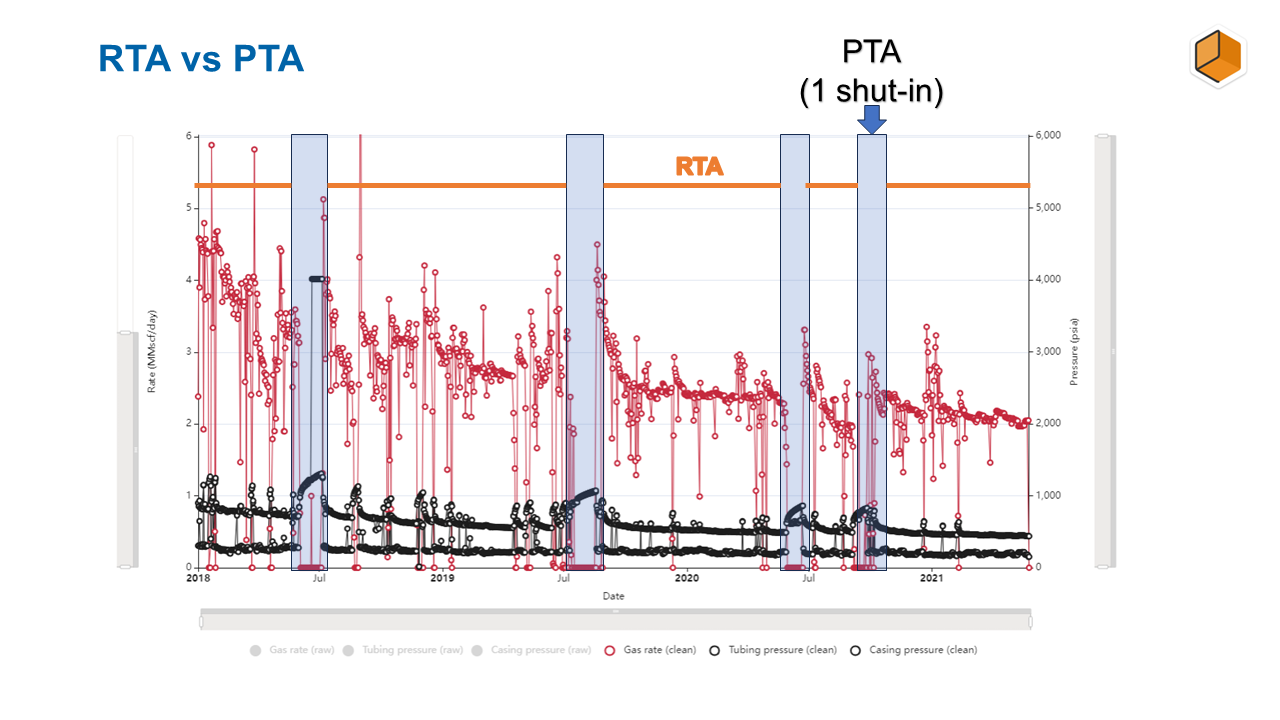
The graphic below gives an visual representation of PTA vs RTA. In this example, there are four (4) major shut-in periods which are used for PTA work, while the remainder of ALL “flowing “data is used for RTA. In summary:
-
In PTA, we focus on individual shut-in periods
-
In RTA, we focus on ALL the flowing data, while ignoring ALL the shut-ins
See Also:
References
-
RTA in whitson+, Mathias Carlsen, Mohamad Dahouk, Curtis Whitson, 26 June 2023