
For CSG, refer to Cleat Porosity
Introduction
Porosity is simplify defined as the ratio of pore space to total bulk volume of a rock or substance. Porosity is usually expressed as a percentage:
' aria-hidden='true'%3e %3cg transform='translate(167%2c0)'%3e %3cg transform='translate(-11%2c0)'%3e %3cuse xlink:href='%23E1-MJMATHI-3D5' x='0' y='0'%3e%3c/use%3e %3cuse xlink:href='%23E1-MJMAIN-3D' x='874' y='0'%3e%3c/use%3e %3cg transform='translate(1652%2c0)'%3e %3cg transform='translate(397%2c0)'%3e %3crect stroke='none' width='2327' height='60' x='0' y='220'%3e%3c/rect%3e %3cg transform='translate(60%2c677)'%3e %3cuse xlink:href='%23E1-MJMATHI-56' x='0' y='0'%3e%3c/use%3e %3cg transform='translate(583%2c-150)'%3e %3cuse transform='scale(0.707)' xlink:href='%23E1-MJMATHI-50' x='0' y='0'%3e%3c/use%3e %3cuse transform='scale(0.707)' xlink:href='%23E1-MJMATHI-6F' x='751' y='0'%3e%3c/use%3e %3cuse transform='scale(0.707)' xlink:href='%23E1-MJMATHI-72' x='1237' y='0'%3e%3c/use%3e %3cuse transform='scale(0.707)' xlink:href='%23E1-MJMATHI-65' x='1688' y='0'%3e%3c/use%3e %3c/g%3e %3c/g%3e %3cg transform='translate(177%2c-704)'%3e %3cuse xlink:href='%23E1-MJMATHI-56' x='0' y='0'%3e%3c/use%3e %3cg transform='translate(583%2c-150)'%3e %3cuse transform='scale(0.707)' xlink:href='%23E1-MJMATHI-62' x='0' y='0'%3e%3c/use%3e %3cuse transform='scale(0.707)' xlink:href='%23E1-MJMATHI-75' x='429' y='0'%3e%3c/use%3e %3cuse transform='scale(0.707)' xlink:href='%23E1-MJMATHI-6B' x='1002' y='0'%3e%3c/use%3e %3cuse transform='scale(0.707)' xlink:href='%23E1-MJMATHI-6C' x='1523' y='0'%3e%3c/use%3e %3c/g%3e %3c/g%3e %3c/g%3e %3c/g%3e %3c/g%3e %3c/g%3e %3c/g%3e %3c/svg%3e)
For conventional reservoirs, see below. This porosity may be filled with a variety of fluids (gaseous or liquid). Fluid-productive sandstones display porosities ranging between 0.05 and 0.4, or 5% - 40% (this range changes with the literature with others saying 5% to 25%). Tight Gas and Shale have porosity values at the lower end of the spectrum as discussed here: Shale Porosity .
Although the porosity of carbonate base material is practically zero, the overall porosity of carbonate rocks can be significant due to natural fractures within the rocks.
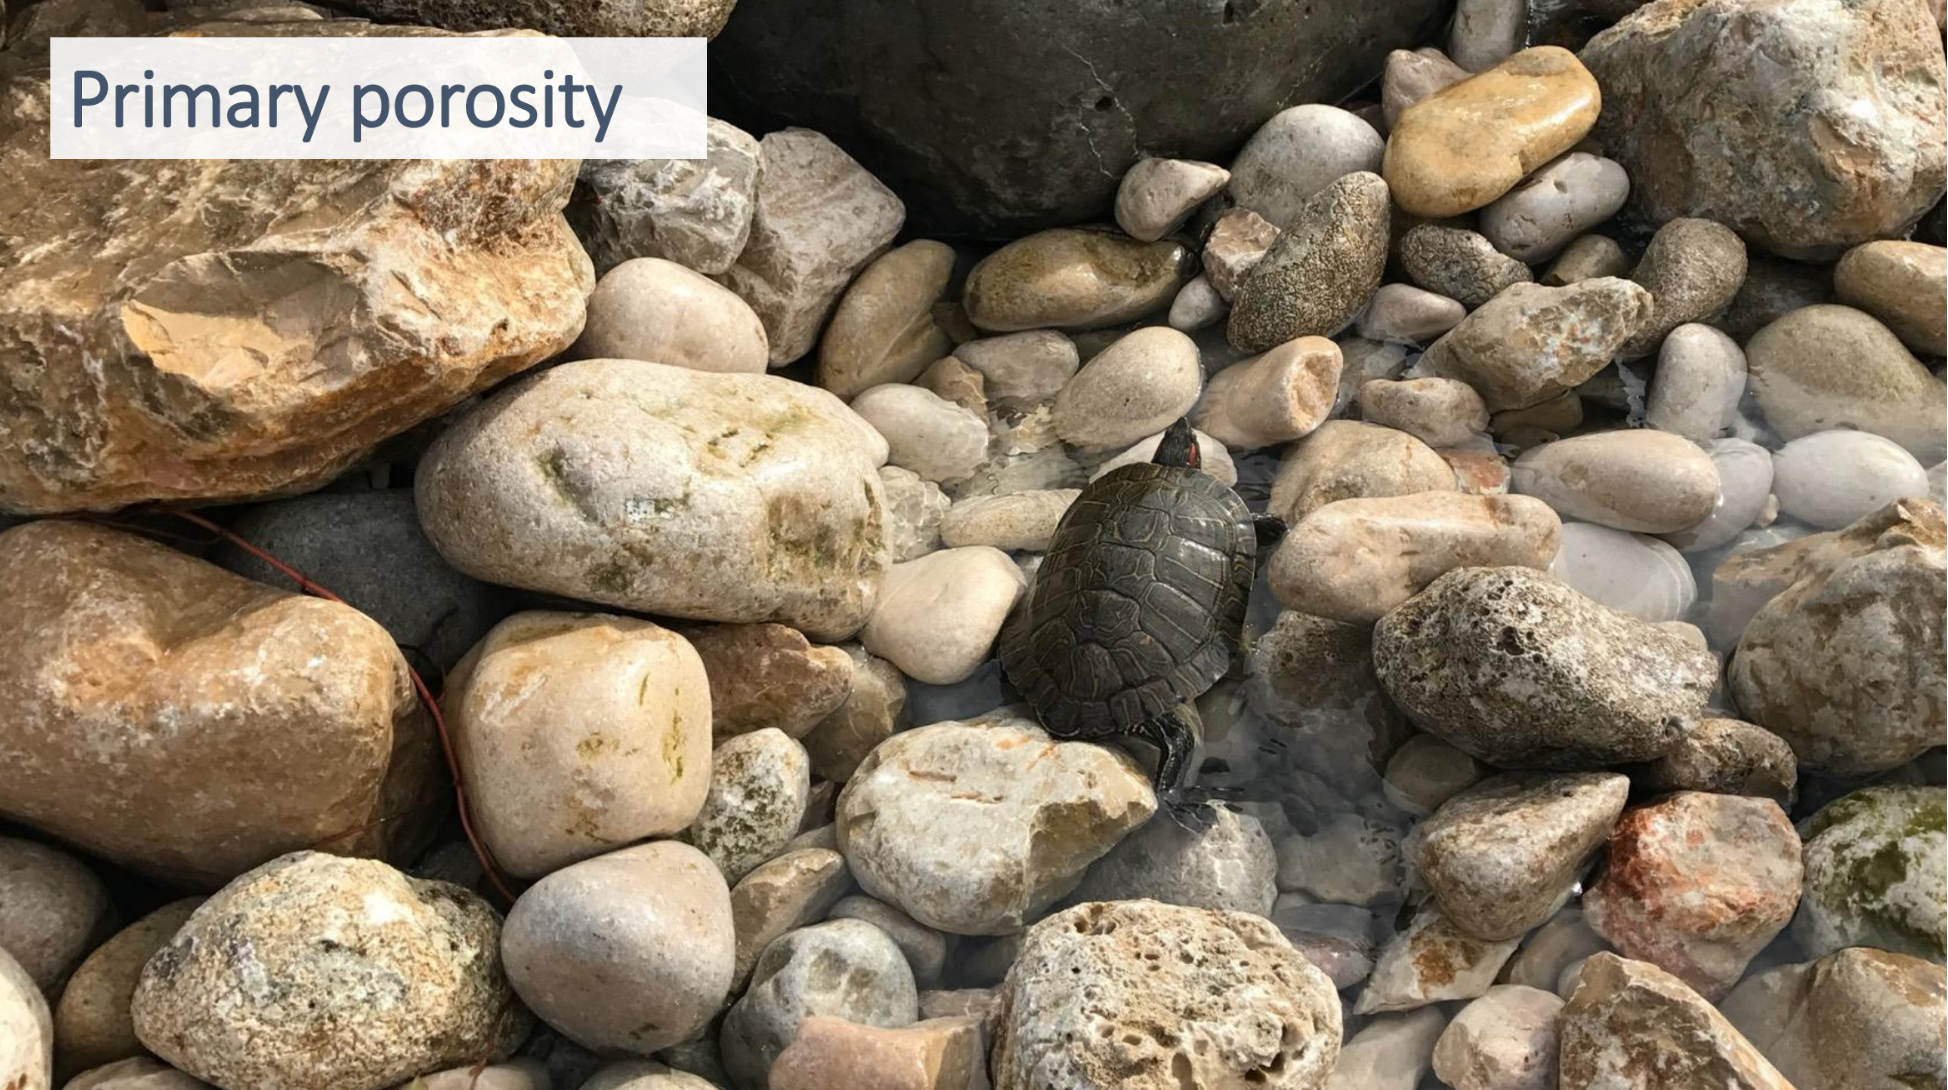
Primary Porosity
Below is an example of primary porosity. Primary porosity describes the pore spaces between grains that are formed during depositional processes, such as sedimentation and diagenesis.
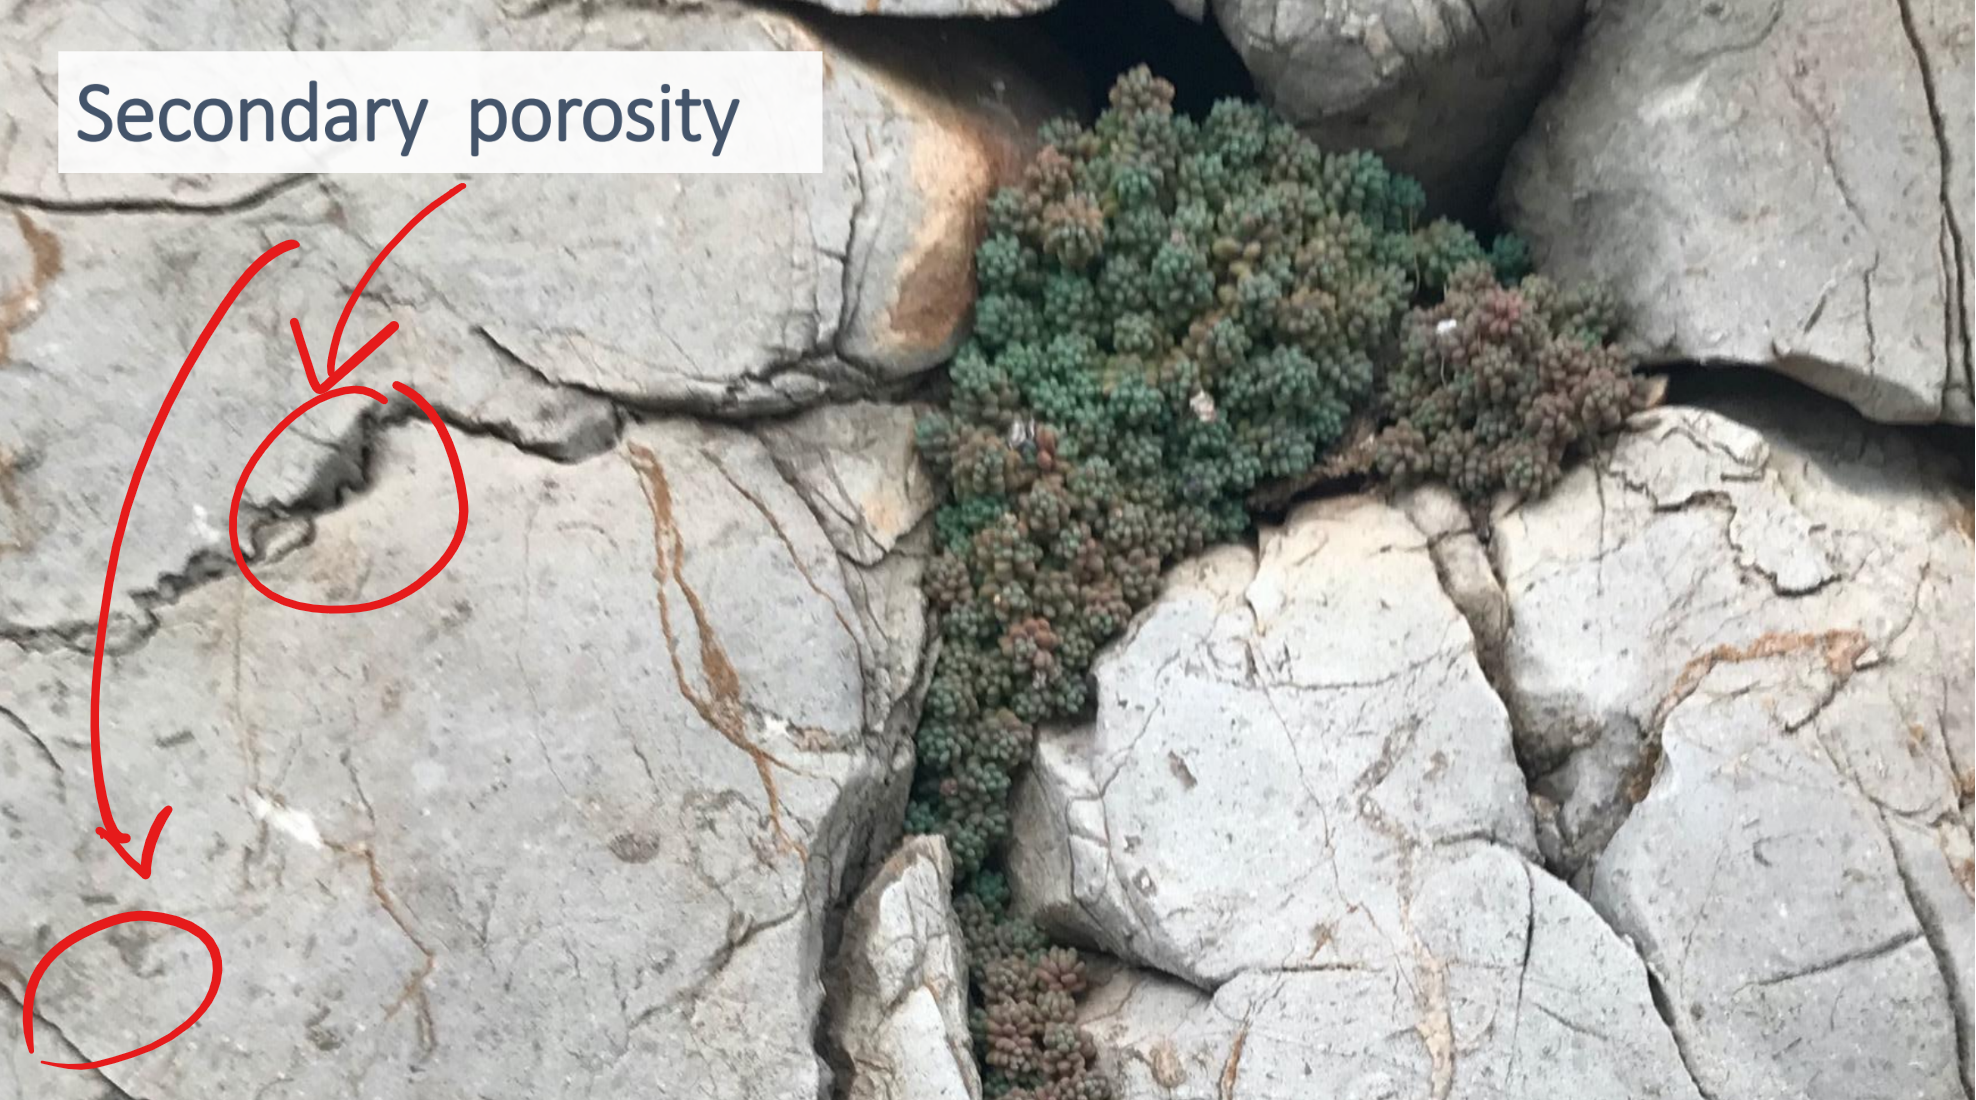
Secondary Porosity
Below is an example of secondary porosity. Secondary Porosity is formed from post depositional processes, such as dissolution, reprecipitation, fracturing, and leaching. In analytical models (RTA/PTA), secondary porosity is often modelled using'Dual Porosity models.
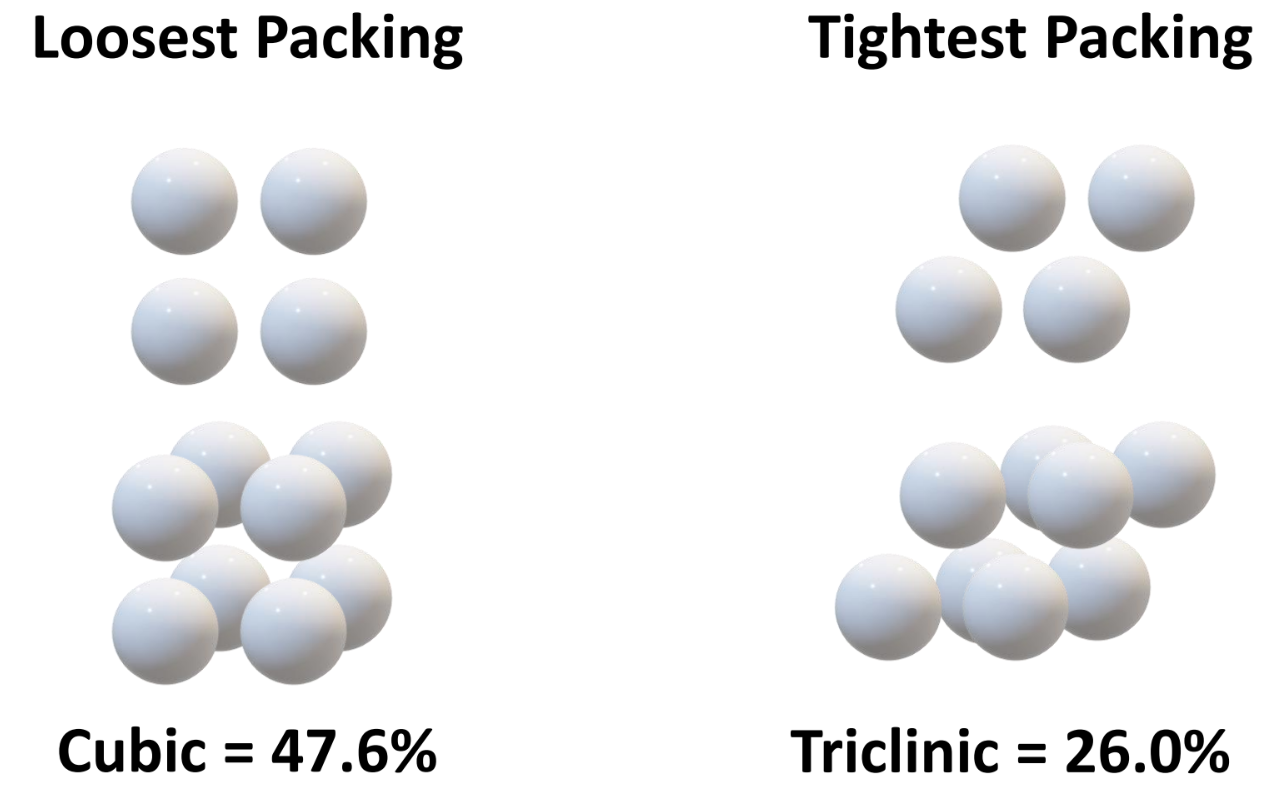
Effect of Packing (Consolidation)
The examples below idealized (theoretical) porosities for cubic and triclinic scenarios. It is interest sing to not that grain size (assuming all grains are the same size) has no impact on these calculated numbers. However poorly sorted grains (I.e., grains of different sizes) does reduce porosity significantly. In cases where the fit is very tight and there are no gaps or pore spaces between the grains or crystals, we say that this rock has no porosity.
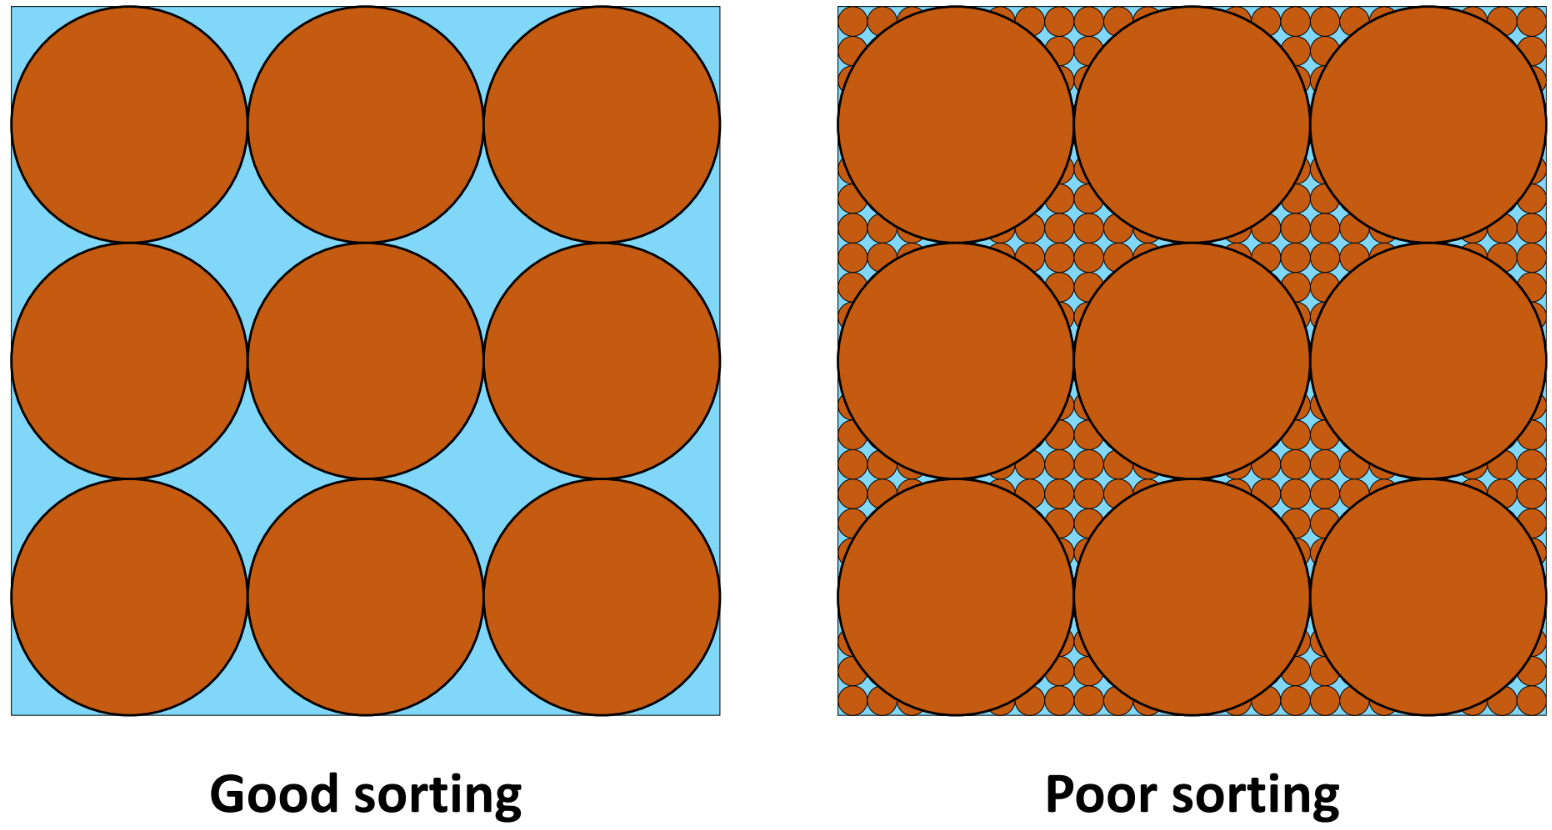
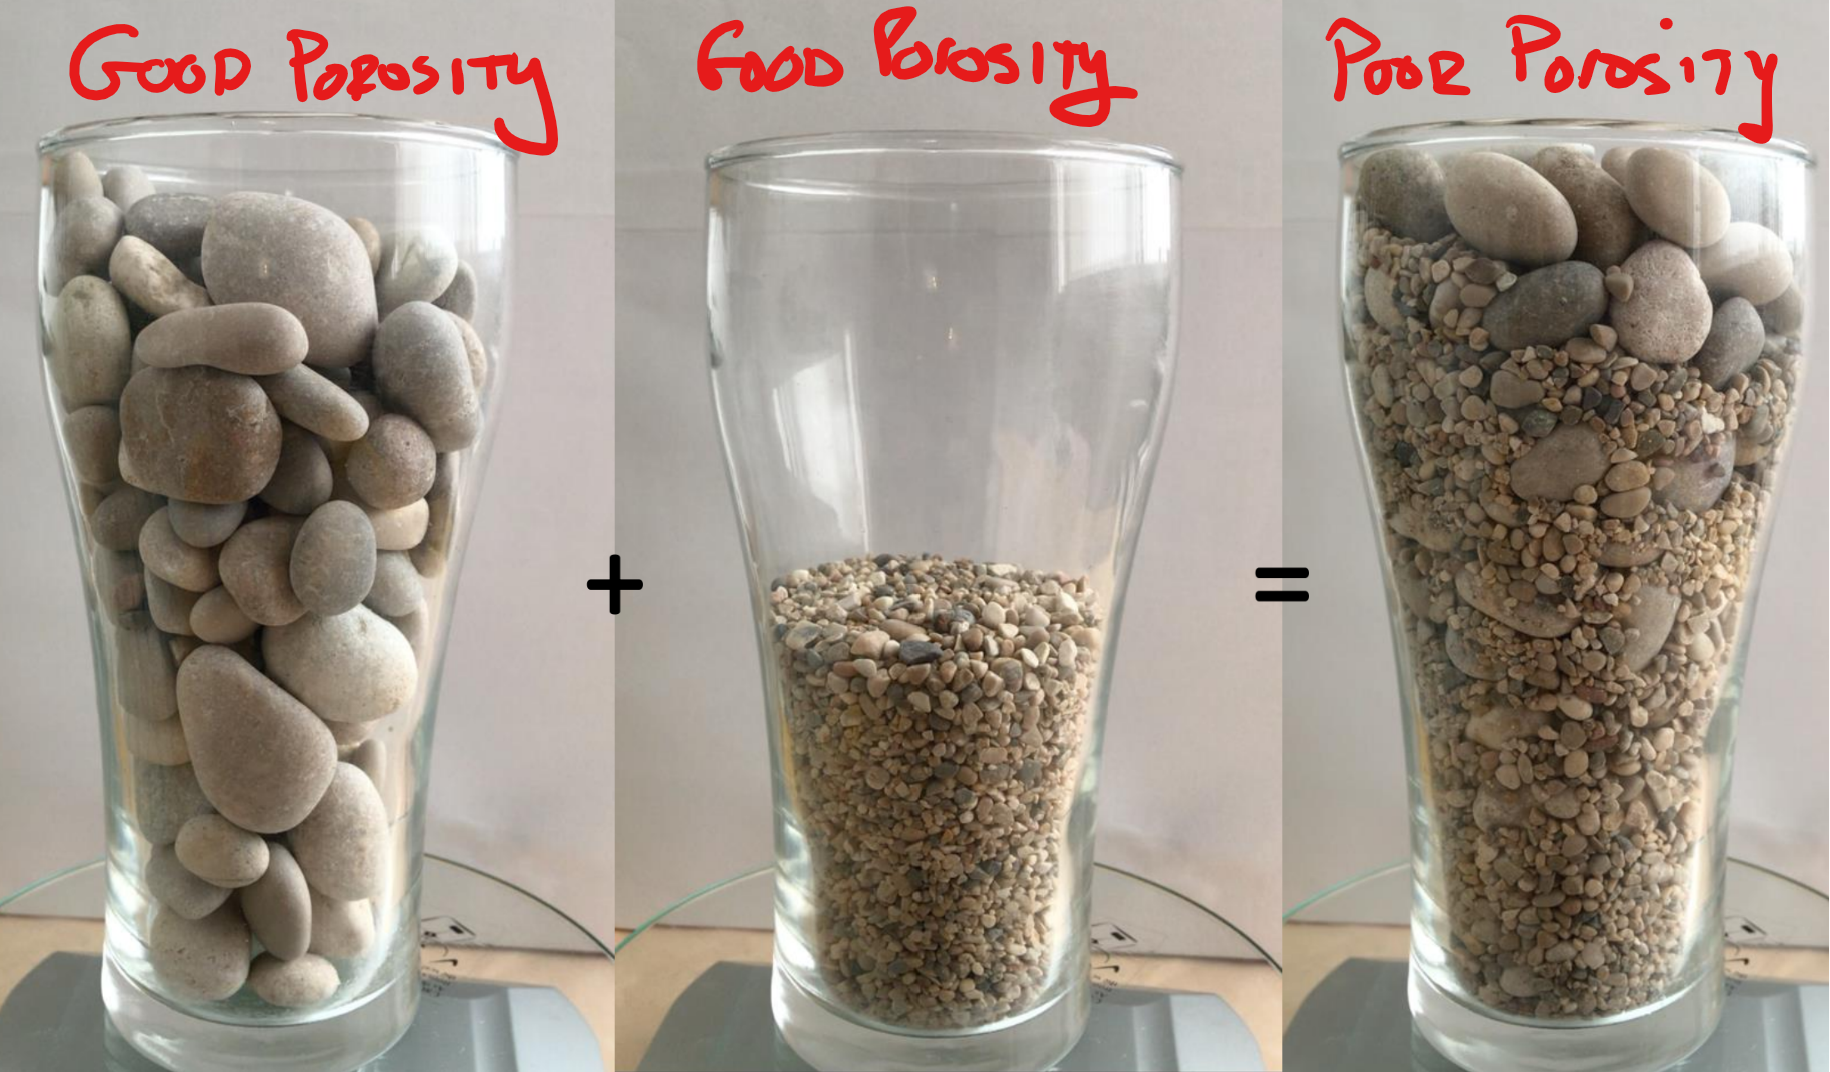
In the example below, both systems on the left had similar porosity, while the combination of the two resulted in a lower porosity. The Beard and Weyl Data, provided by Blasingame, demonstrates this concept very well.
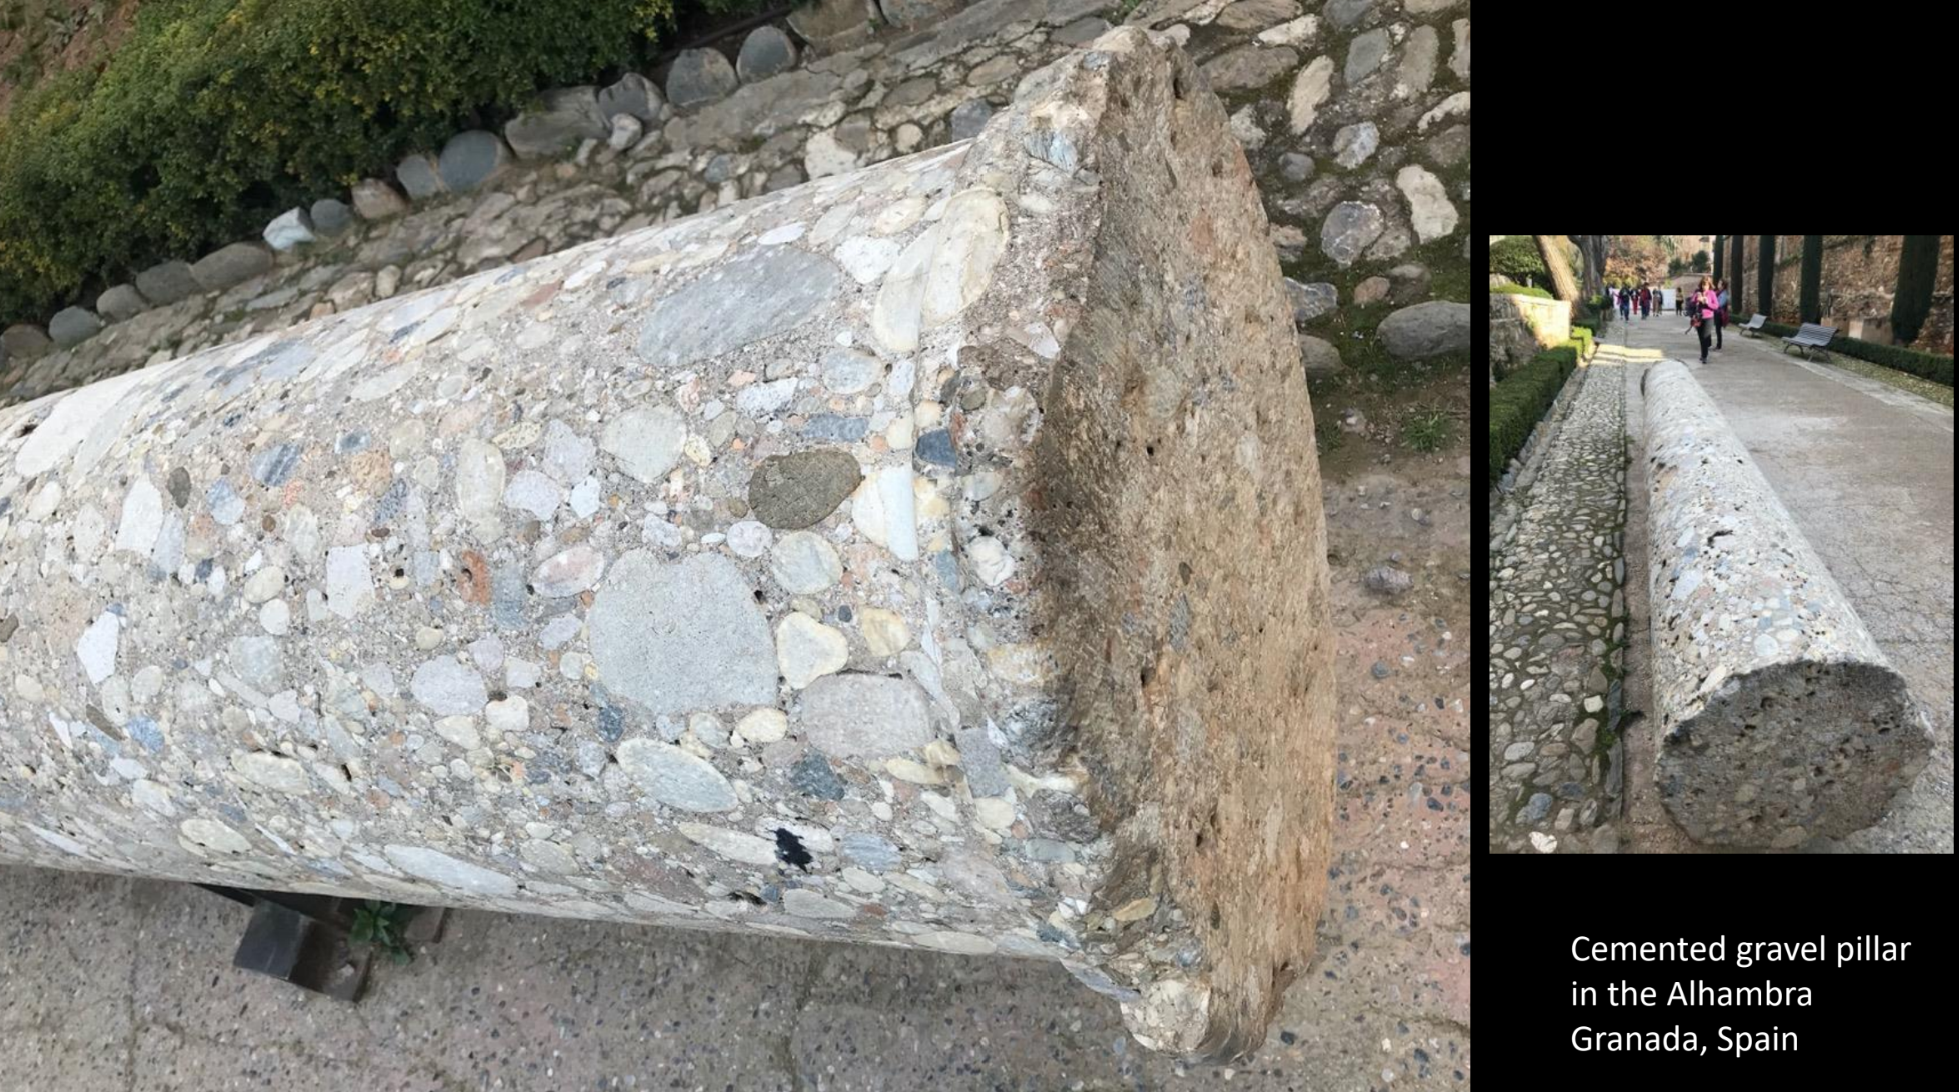
Cemented Porosity
Secondary minerals can deposit in the poor space of a rock, reducing the total porosity. Clays can have significant degradation of porosity.
Additional Reading:
See Also:
References:
-
Australian Water School, 2024
-
T. A. Blasingame “Reservoir Petrophysics: Introduction to Geology” , Texas A&M University, Course P663
-
B. Guo, Well Productivity Handbook: Vertical, Fractured, Horizontal, Multilateral, and Intelligent Wells, 2008
-
Abdus Satter & Ghulam, Reservoir Engineering The Fundamentals, Simulation, and Management of Conventional and Unconventional Recoveries, 2016.