
Introduction
This module will also a user to perform Water-Oil-Ratio (WOR) analysis, and related diagnostics for oil wells producing water.
AFA requires at least 1 Project and 1 Group to perform any analyses or simulation. Please refer to Create a Project and sub-topics if required.
Step 1: Select the SPAD WOR
The gas decline module shown near the top of the AFA Grid.
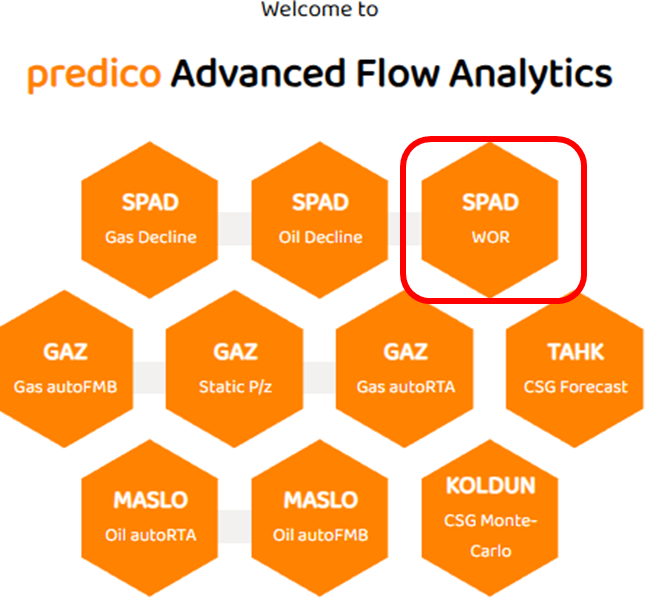
The SPAD WOR module will only be available if the selected well has both reported water and oil volumes. It does not matter if the well is designated as gas, oil, CSG, or other.
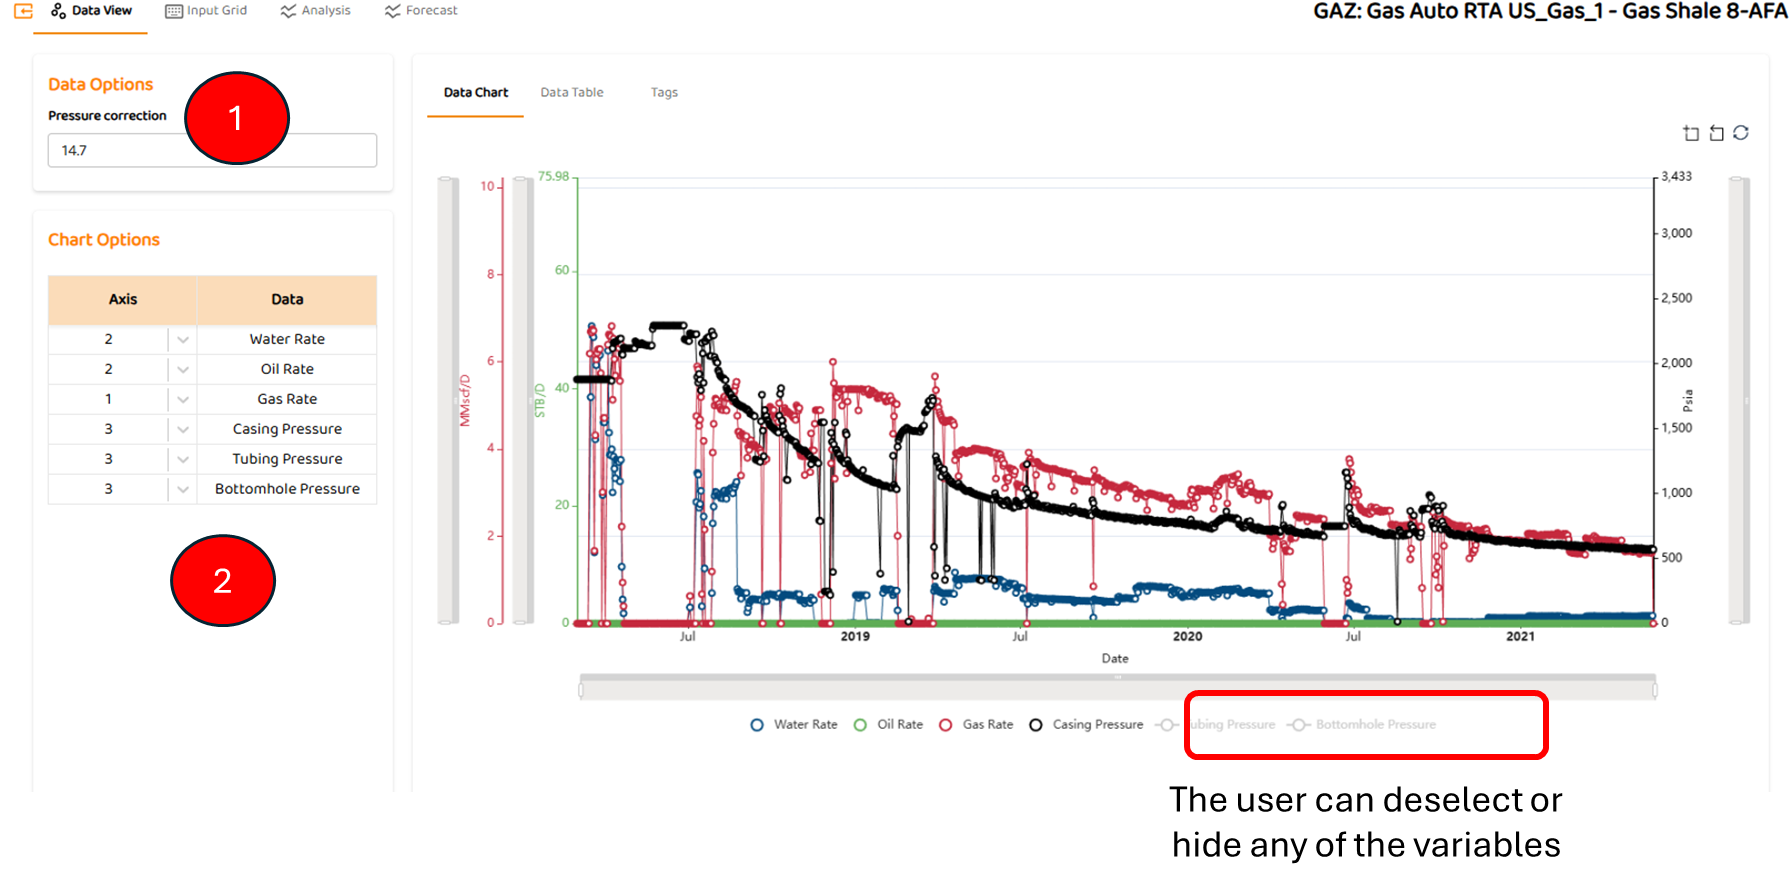
Step 2: Data View
Data View is the first tab in most modules. It shows all the major data sources imported for this well (pressures, rates, etc). Some specific items are:
-
Pressure Correction if desired. Can be zero.
-
Options to select which axis a data set below (left or right)
Step 3: Analysis
The analyses tab for SPAD WOR is shown below. There are three different types of analyses (including low, medium, and high sensitivities) collectively grouped under WOR including:
-
WOR (Traditional)
-
This is default analyses when entering the WOR module
-
-
1/fw (Water Fraction)
-
fo (Oil Fraction)
The analysis tab also contains forecasts for each phase including:
-
Oil and Water
And finally
-
Analysis Summary
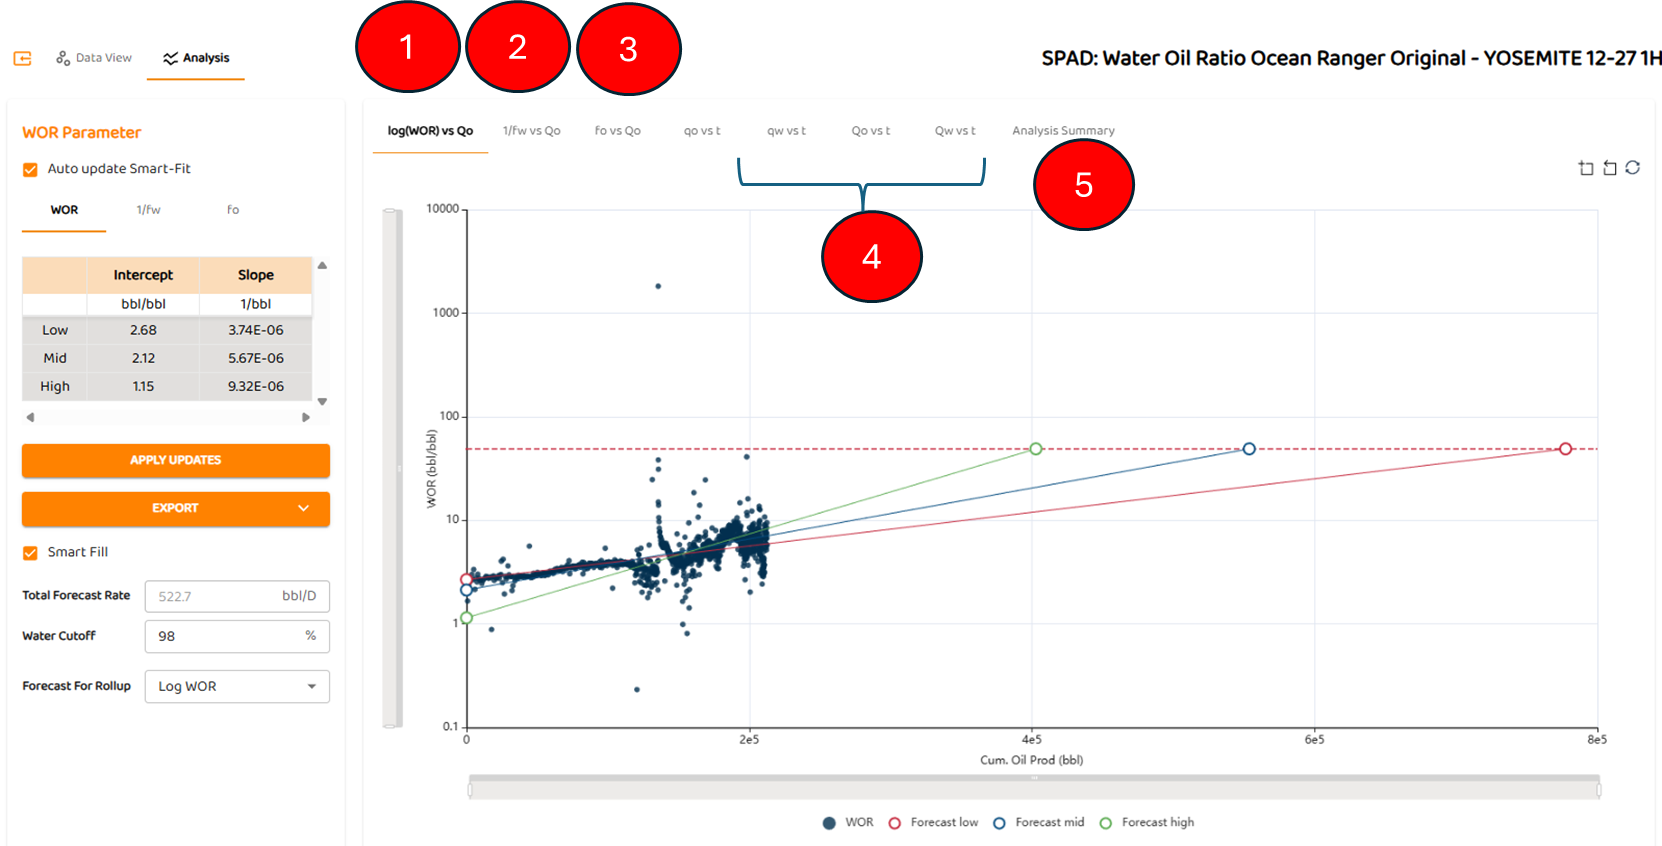
To perform any of these automated analyses, the user needs to enter “ Water Cut-off”. It will have an impact on WOR, fo, and 1/fw analyses.
-
In this example show below, the target cut-off is set to 98% water.
-
For RULON: Roll-Up purposes, the user must selection which analysis method they chose as the primary forecast
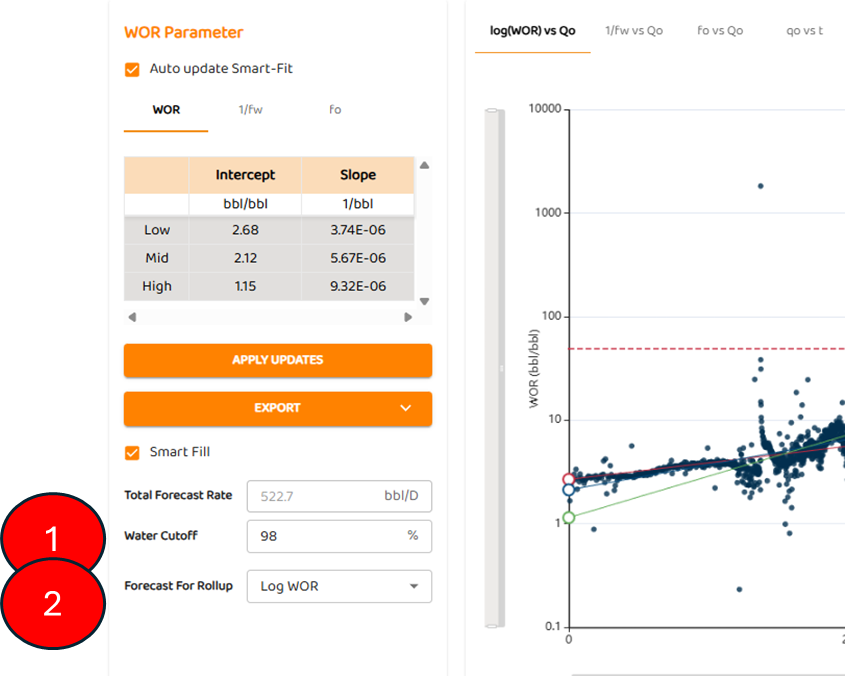
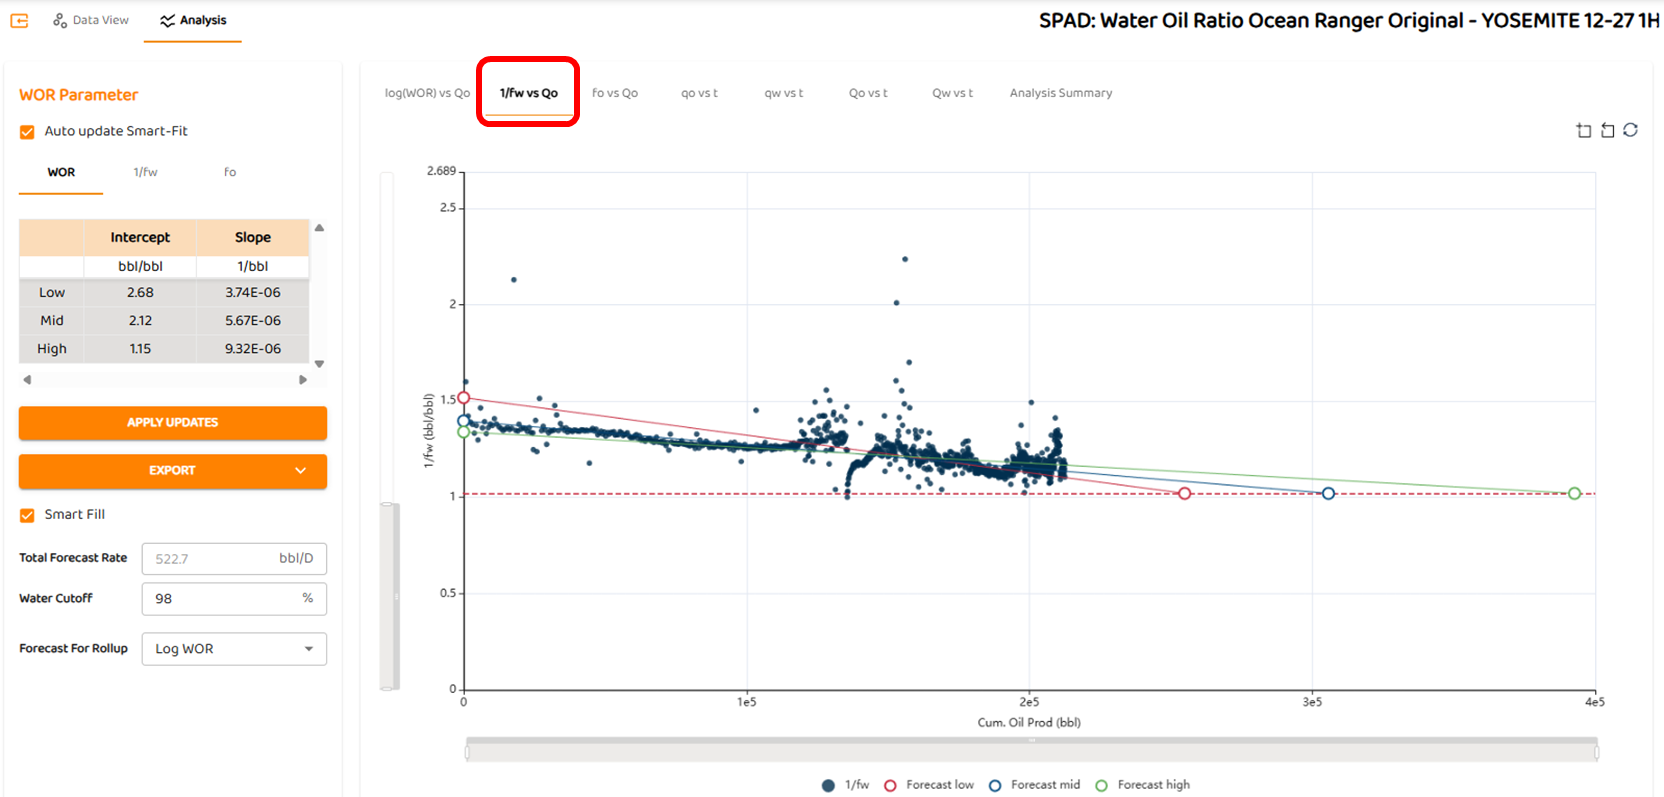
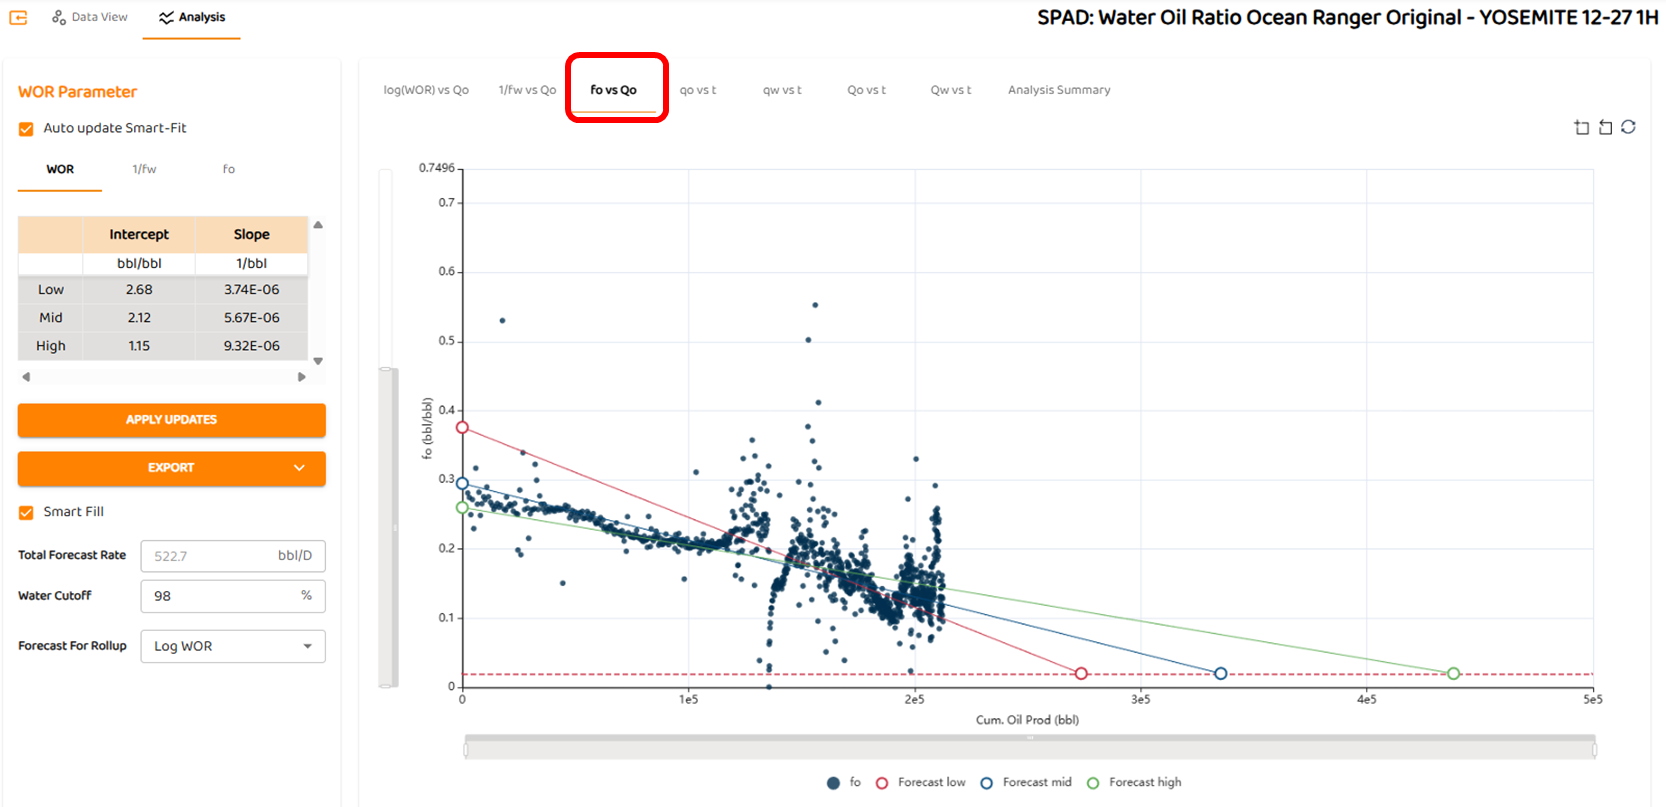
Step 4: Viewing the 1/fw or fo Analyses
As shown below, the user must click the remaining tabs to see either 1/fw or the fo analysis.
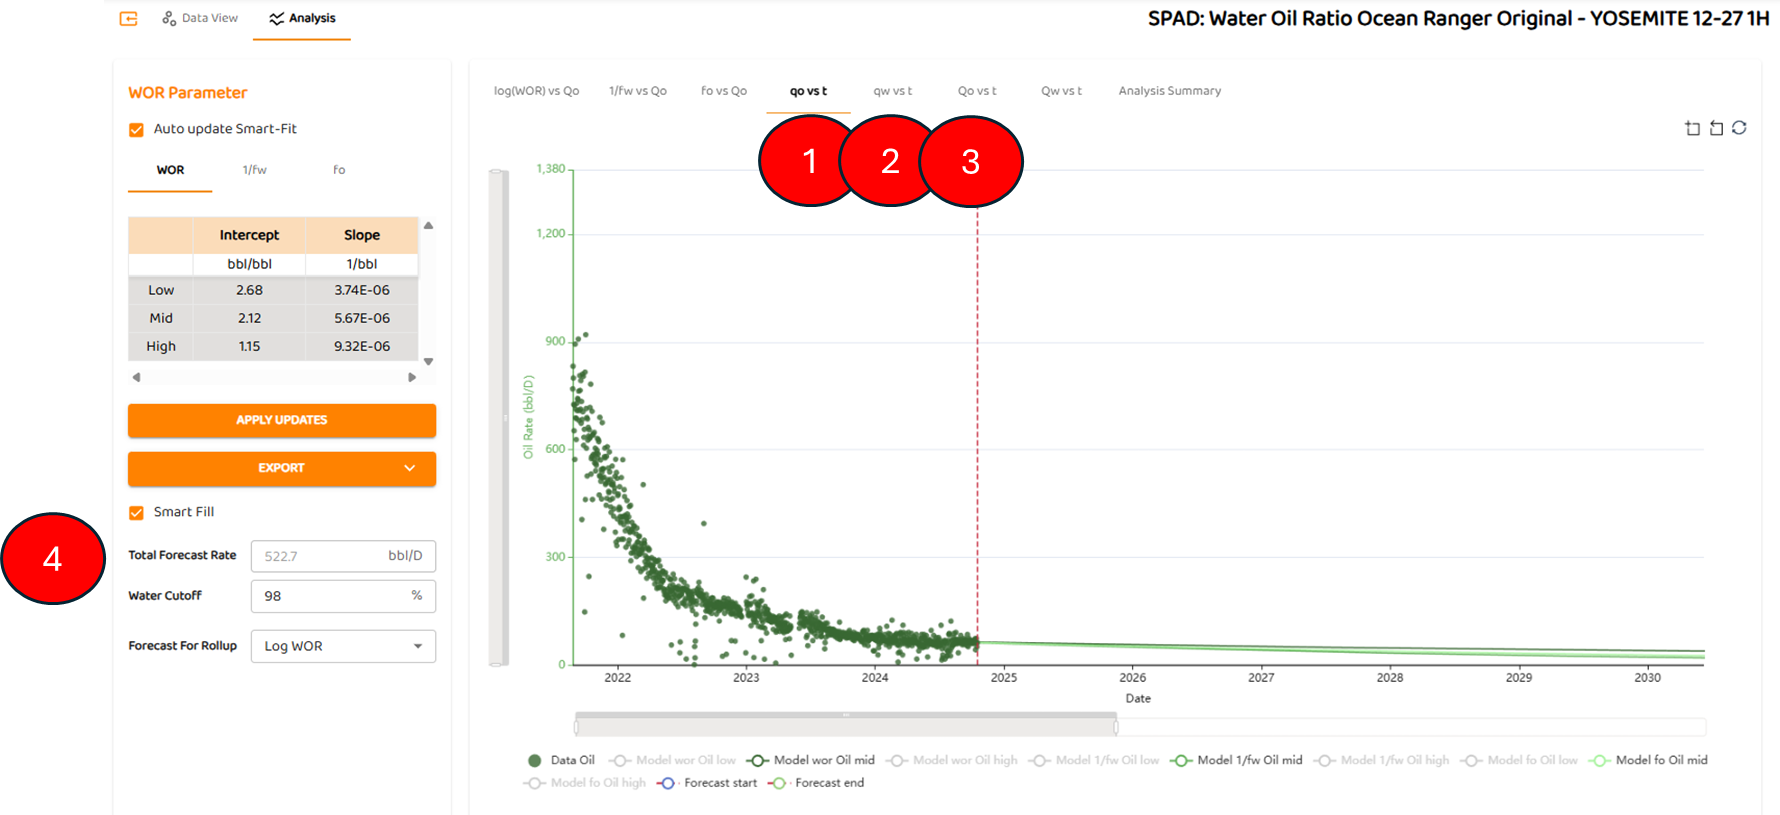
Step 5: Forecast Tabs
There are three forecast tabs including
-
qo vs t
-
qw vs t
-
qw vs t
-
All three forecast assume the “Total Forecast Rate“ (or total fluid rate), and break out the oil and water percentages based on WOR, 1/fw, and fo forecasts.
-
For each phase, there 6 curves representing low, medium, and high forecasts for each analysis method.
-
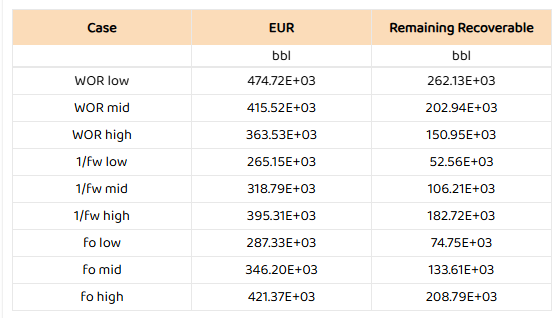
Step 6: Analysis Summary
As shown below, the Analysis summary provides EUR and Remaining Recoverable for any analyses method selected. All results are generated simultaneously
See Also: