
According to the Canadian Government (specifically, the Canada Energy Regulator), the plot below shows the average production (from core areas) of the Montney (Hybrid) Shale from 2001 to 2017.
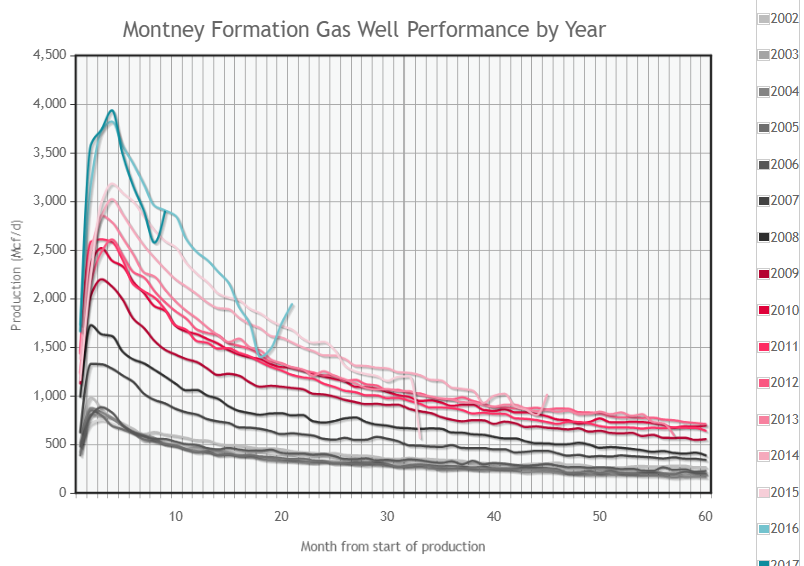
According to the CRE, this figure shows that technology has helped newer wells outperform older wells. Peak production rates were 0.9 million cubic feet of gas per day (MMcf/d) for wells drilled in 2005, but more than quadrupled to almost 4 MMcf/d for wells drilled in 2017. After 5 years of production, newer wells continue to have higher rates of production. A well drilled in 2005 typically flowed 0.2 MMcf/d after 5 years while a well drilled in 2012 flowed 0.7 MMcf/d. Wells drilled after 2012, which do not yet have 5 years of available production data, could have higher 5-year production rates as well.
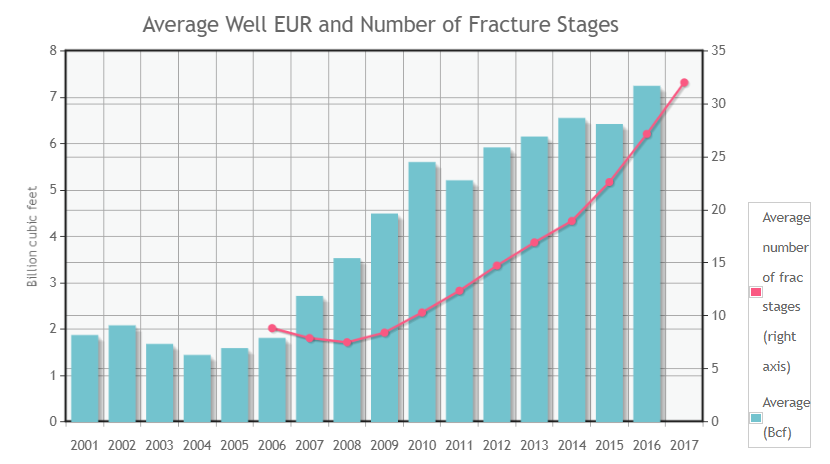
Most of this improvement was attributed to:
-
Increasing the number of frac stages
-
Length of Wells
As an example, refer to the plot below where the average well EUR is correlated with Number of Fractures Stages. Similar results were reported by Stage Completions who reported that the average nunber of stages increased from 10 (2010) to 26 (2016)
Worked performed by Kong [2002] documented the progression both of fractures and well length in the Montney.
References:
-
Kong et al, RTA-Assisted Type Well Construction in Montney Tight Gas Reservoir from Western Canadian Sedimentary Basin, GeoFluids, 2022.
-
Energy Briefing Note: The Ultimate Potential for Unconventional Petroleum from the Montney Formation of British Columbia and Alberta, 2013.