Introduction
In general, the previously discussed reservoir fluids are classified into five (5) types (excludes Heavy Oil), which are somewhat correlated to the light, intermediate, and heavy-hydrocarbon contents in the mixture. As oil and gas are produced from the reservoir, they are subjected to a series of pressure, temperature, and compositional changes. Such changes affect the volumetric and transport behavoir of reservoir fluids, and consequently the produced oil and gas volumes.
Phase envelopes are used to help identify these fluid types.
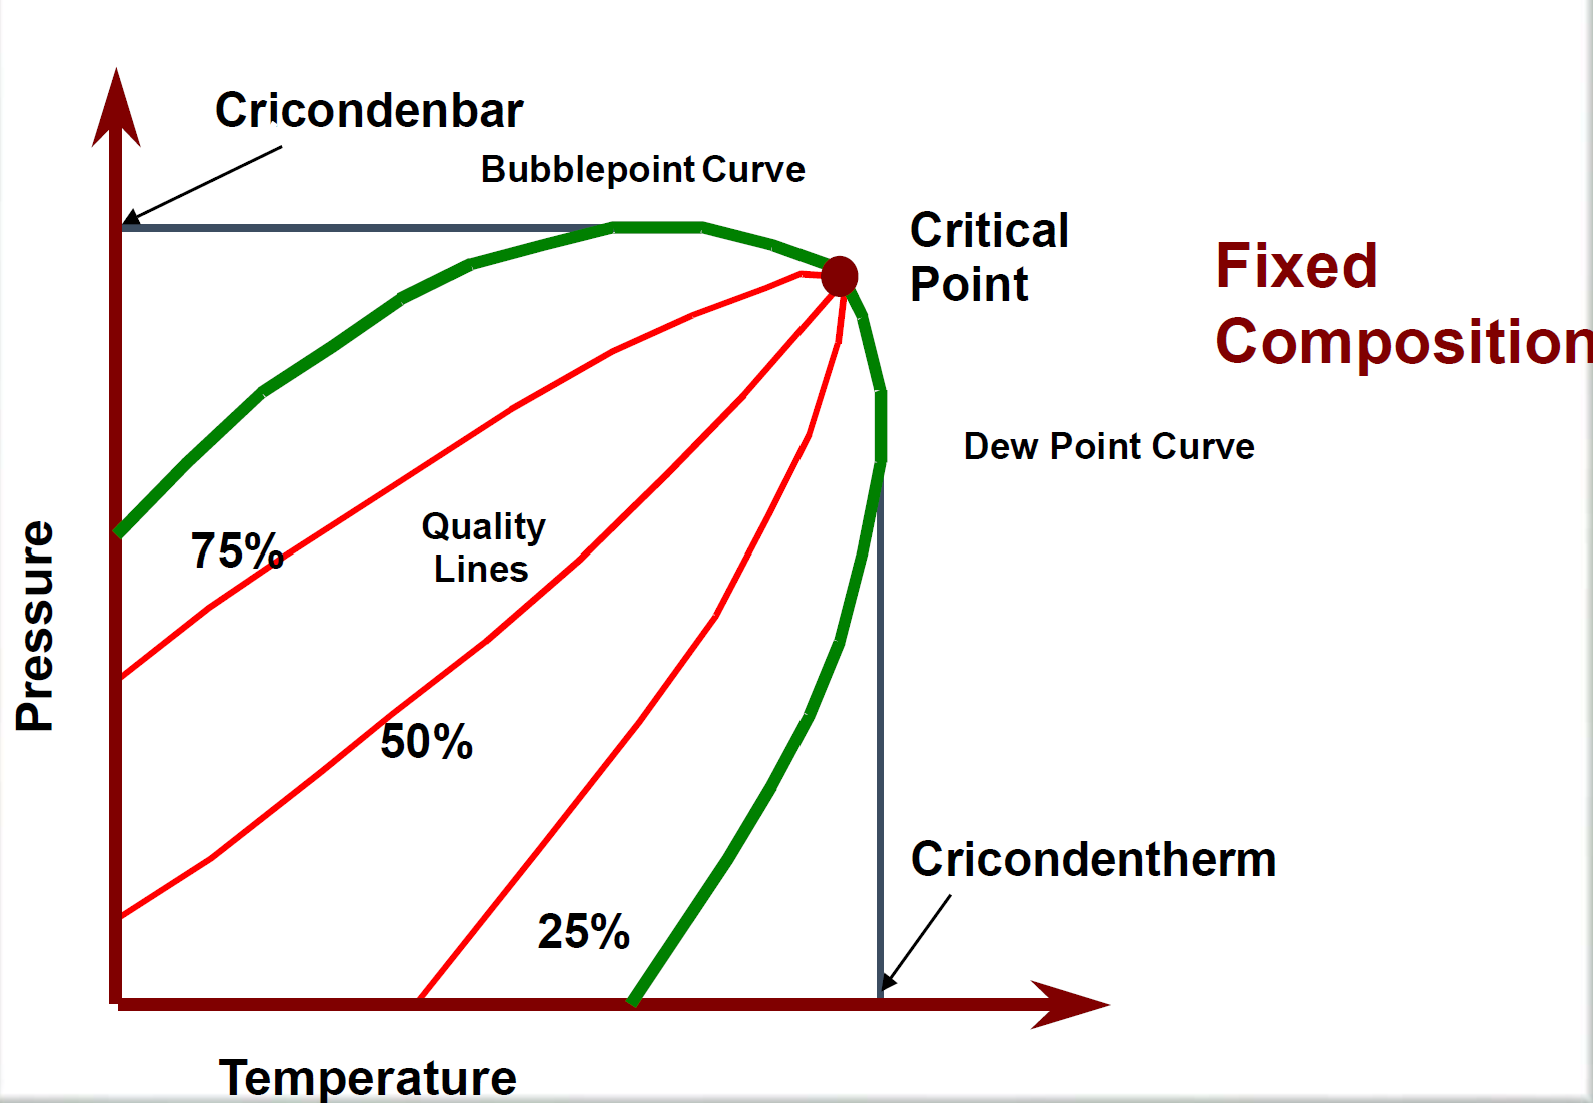
Base Phase Envelope (Multi-Component)
The basic components of a multi-component isotherm are shown below. These include:
-
Critical Point - Represents the condition where the properties of liquid and gas are identical.
-
Crincondenbar - which defines the pressure above which the two phases cannot exist together whatever the temperature. The pressure on the saturation envelope.
-
Cricondentherm - which defines the temperature above which the two phases cannot exist together whatever the pressure. The highest temperature on the phase envelope
-
Dew Point Curve - Curve—the curve that separates the pure gas phase from the two-phase region. It is the connected points of pressure and temperature at which the first liquid droplet is formed out of the gas phase.
-
Bubble Point Curve - Curve—the curve that separates the pure liquid (oil) phase from the two-phase (natural gas and oil) region. This means that at a given temperature, when pressure decreases and below the bubble point curve, gas will be emitted from the liquid phase to the two-phase region.
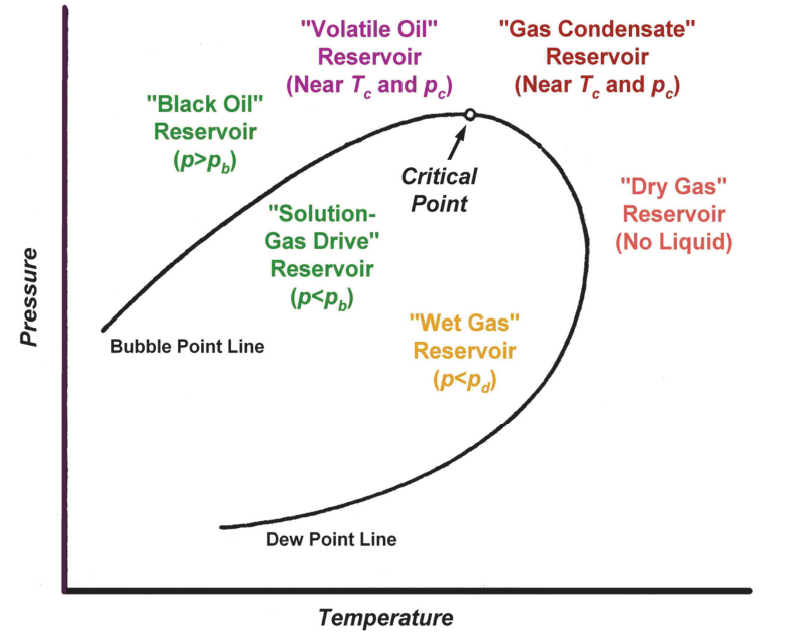
A fluid that exists above the bubble point curve is classified as undersaturated as it contains no free gas, while a fluid at the bubble point curve or below it is classified as saturated, and contains free gas
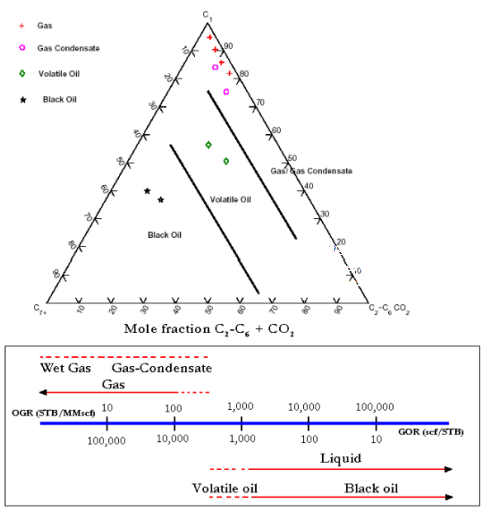
These are five reservoir fluids are:
A phase diagram is generally used to identify the various hydrocarbon systems [Blasingame].
A different visualization is further provided below [Barrufet]:
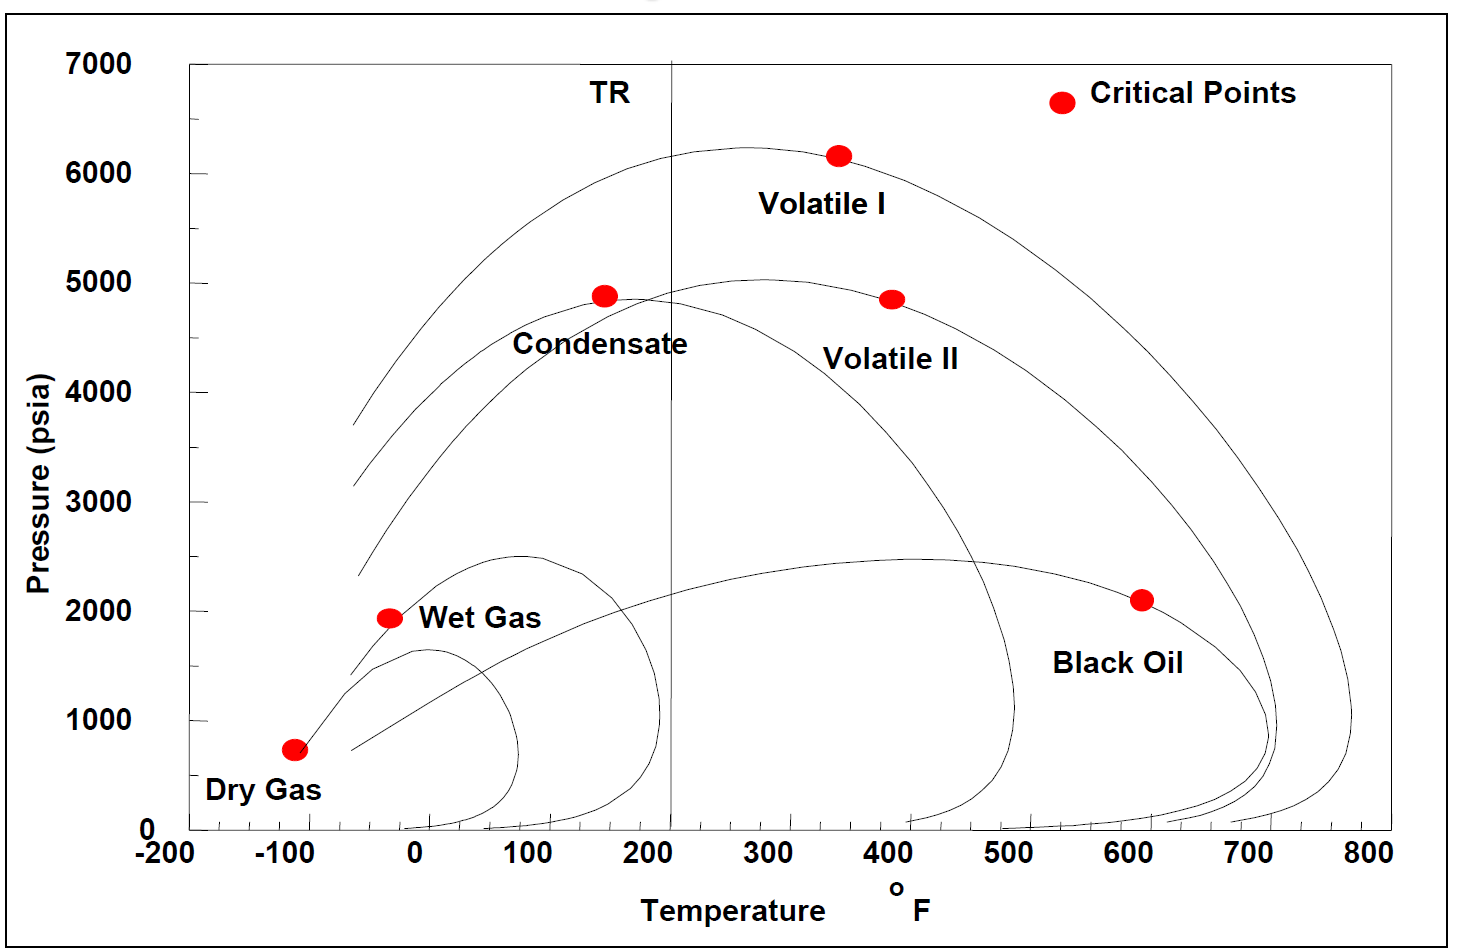
Below, the primary reservoir fluids are shown as a function of hydrocarbon molecule