
Introduction
FMB is short for Flowing Material Balance .
AFA requires at least 1 Project and 1 Group to perform any analyses or simulation. Please refer to Create a Project and sub-topics if required.
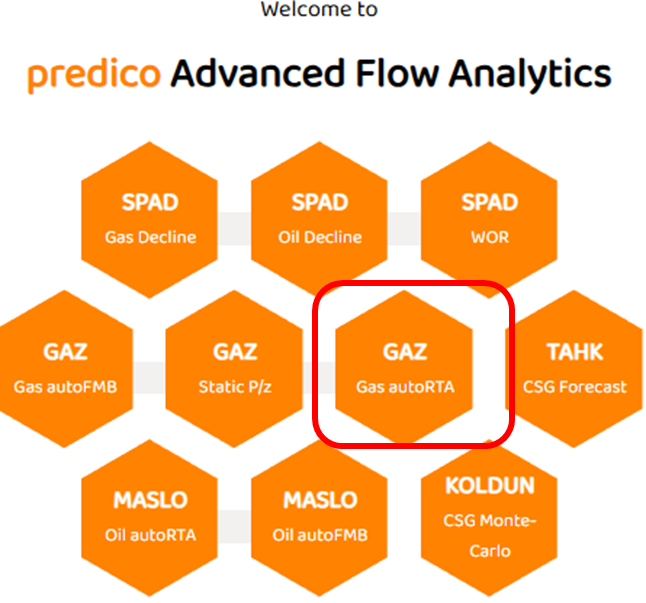
STEP 1: Select the GAZ autoFMB
The gas FMB is part of the GAZ series of modules as shown below:
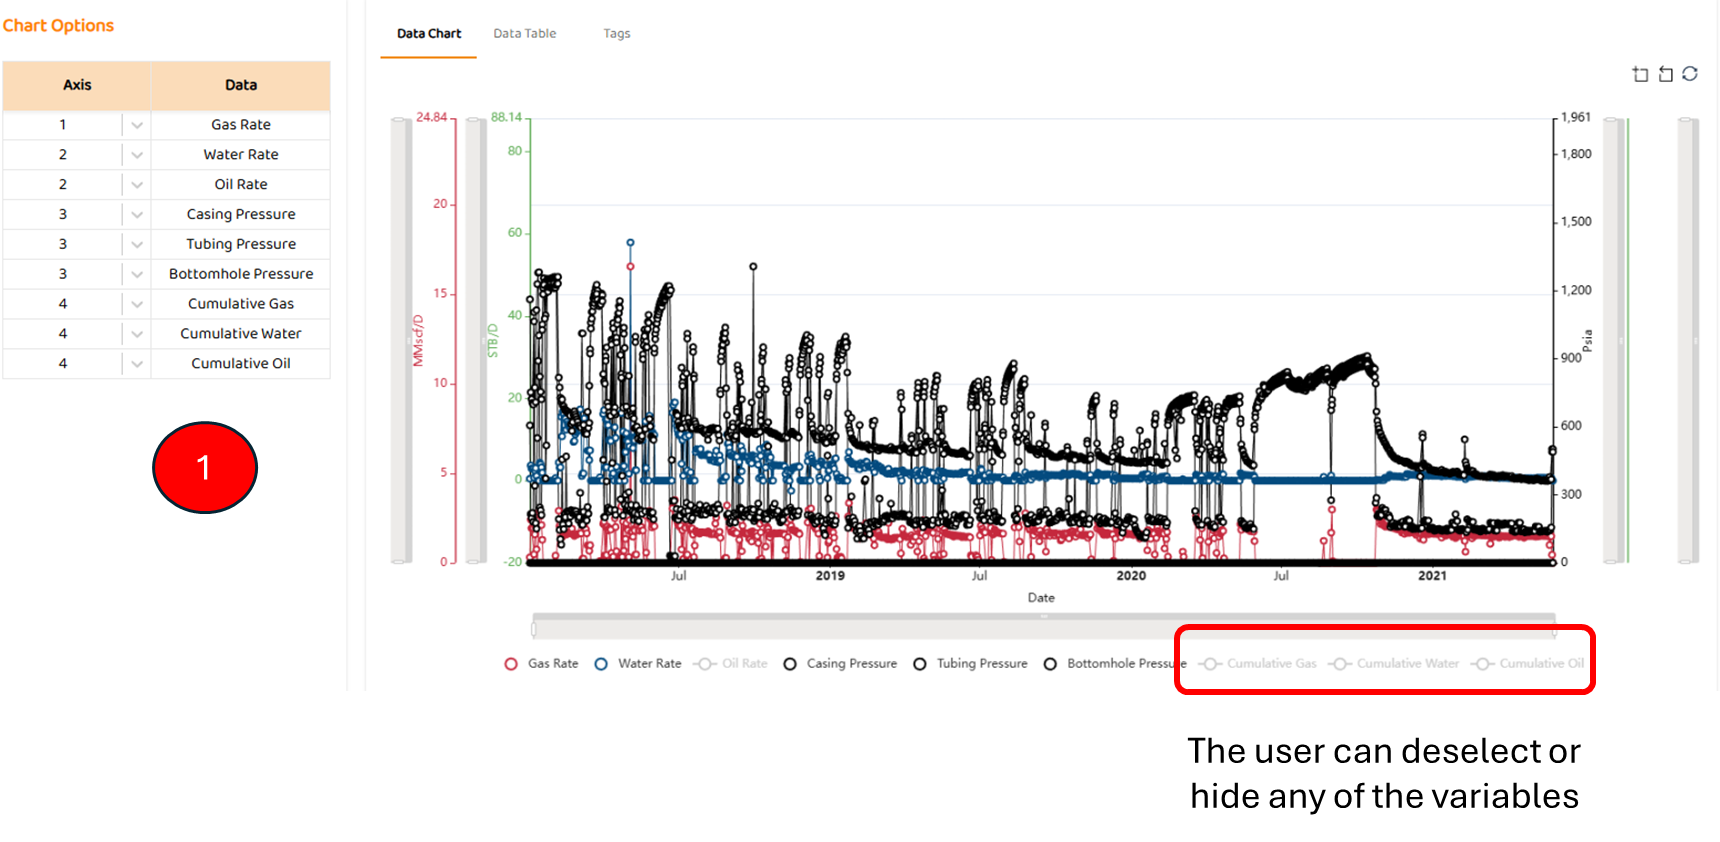
STEP 2: Data View
Data View is the first tab in most modules. It shows all the major data sources imported for this well (pressures, rates, etc). Some specific items are:
-
Options to select which axis a data set below (left or right)
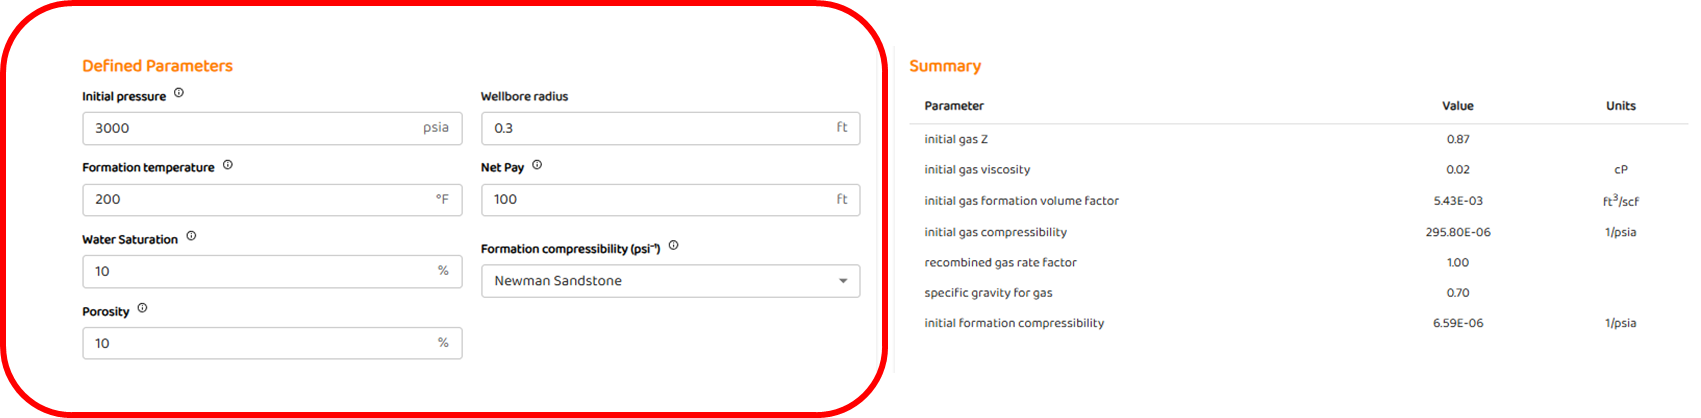
STEP 3: Input Tab
The user must specify all the PVT and rock properties shown below to proceed to the analysis or “Analysis“ tab. On this tab, there are:
STEP 3.1 Defined Parameters
These are initial pressure,
-
subsurface temperature
-
Rock & Formation Compressibility etc. as shown below.
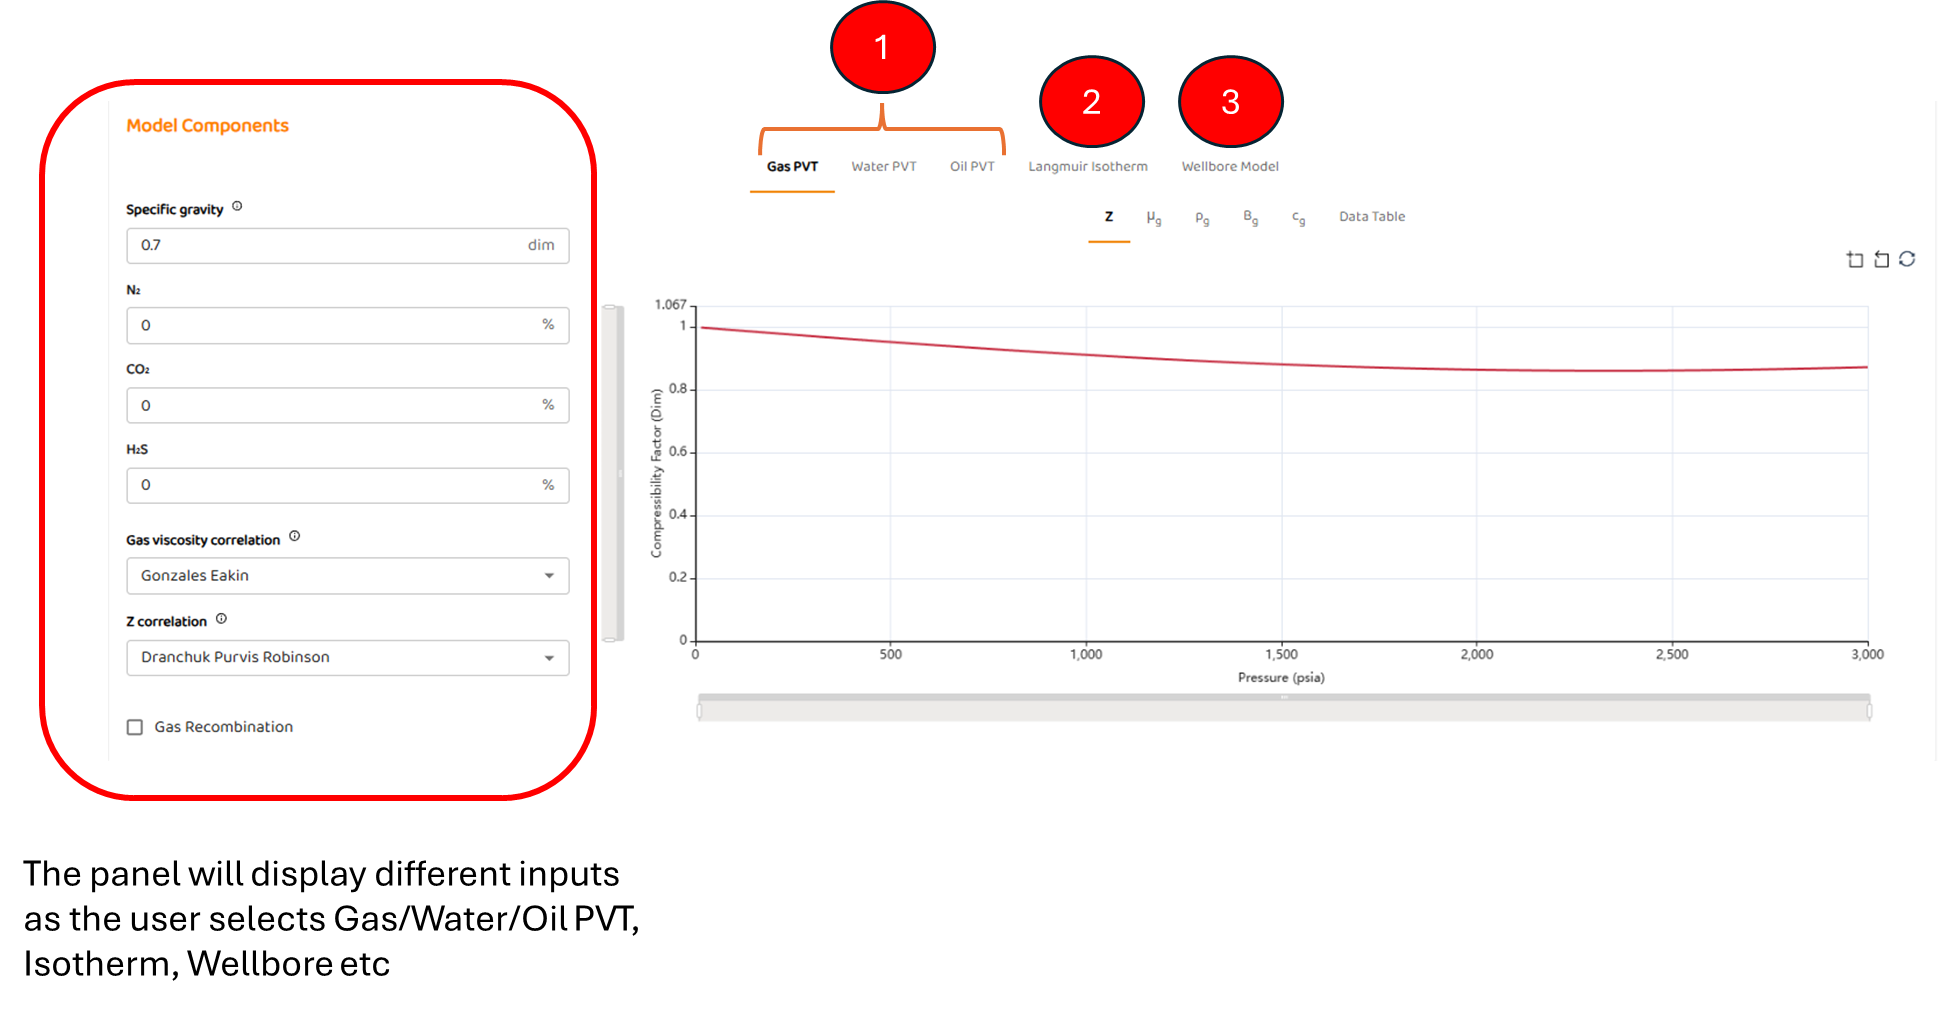
STEP 3.2 Model Components
Model Components is made up off 3 major components
-
Gas, Water, and Oil PVT
-
Langmuir Isotherm . Refer to autoRTA: Langmuir Isotherm for the workflow.
-
Wellbore Model.
In the example below, the user has selected the Gas PVT Tab. The display panel shows all the required inputs for that tab. The same will occur if you select any of the other remaining tabs.
STEP 3.2.1 Wellbore Model
Refer to autoRTA: Wellbore Model as the workflow is the same for all transient model, both oil and gas.
STEP 4: Analysis Tab
The Analysis tab allows the user to perform the actual analysis. There are four (4) main components to autoFMB tab:
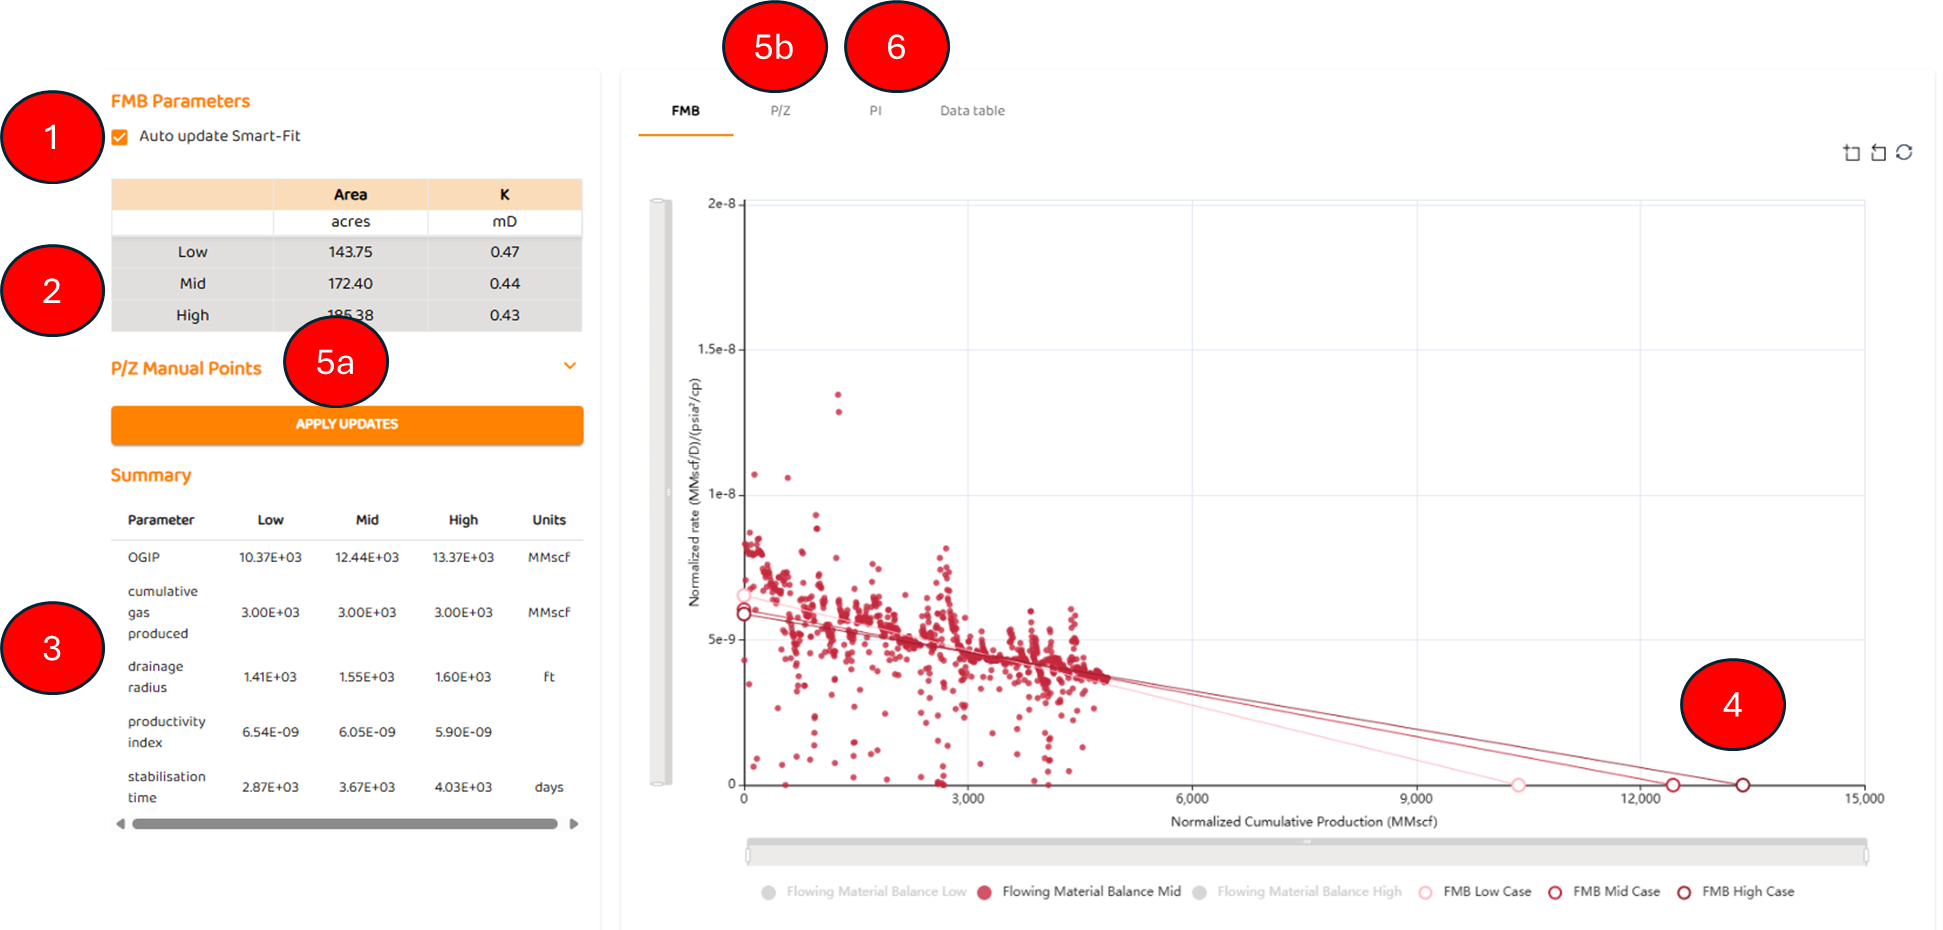
4.1 FMB Results
-
Smart-Fit Option - Default status is on. Using data science three full FMB’s are performed to provide low, medium, and high estimates.
-
Drainage Area and Permeability results from automaton
-
OGIP and volumetric results from automation.
-
Stabilization time is also displayed which represents the time to Boundary Dominated Flow.
-
-
Plot of FMB results
-
FMB P/z Plot (5a and 5b)
Engineering Tips
-
The FMB uses PSS Models and only generates an apparent permeability number which contains the effects of Wellbore Skin and Formation Damage
-
Refer to Scaling in Reservoir Engineering about effective / apparent reservoir models.
-
Refer to Outlier Detection Techniques and Fitting and Repeated Median Regression for additional information on data science.
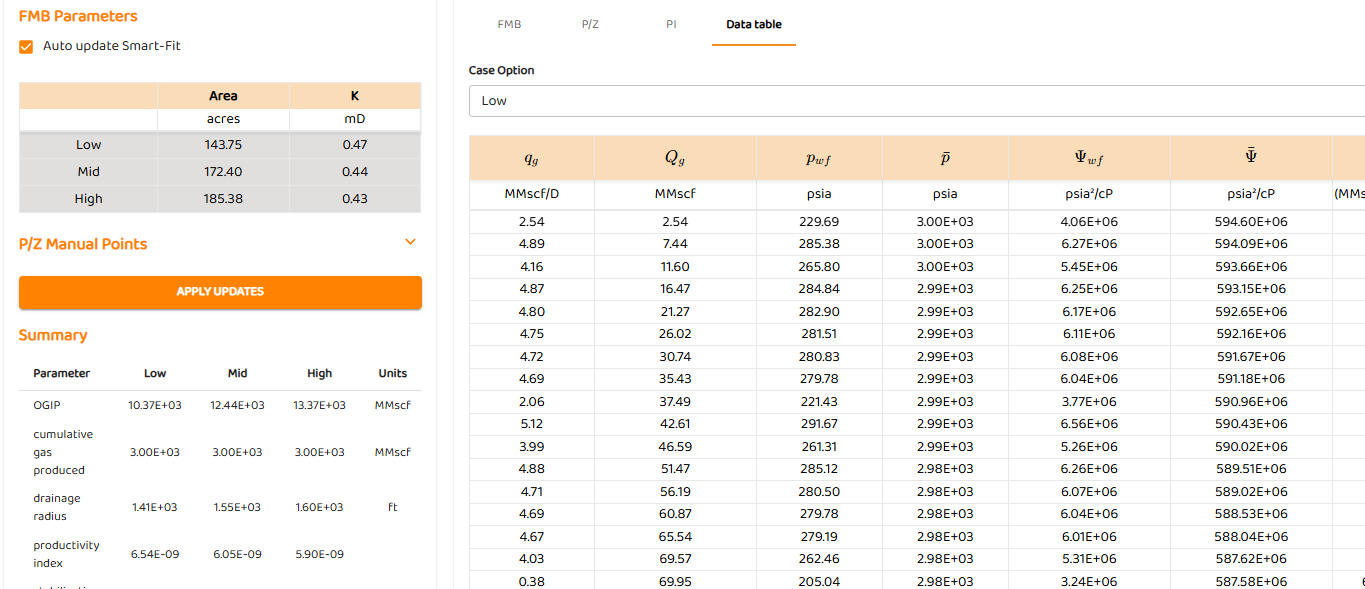
4.2 Data Table of Results
Simply a tabulation of results for all three analyses. You can select to view any sensitivity low, medium or high .
STEP 5: Forecast Tab
The forecast tab simply generates a forecast past the history match period. It contains
-
The Economic Cut-off
-
Summary of results
-
Display of history match and forecast sensitivities (see RTA Sensitivities )
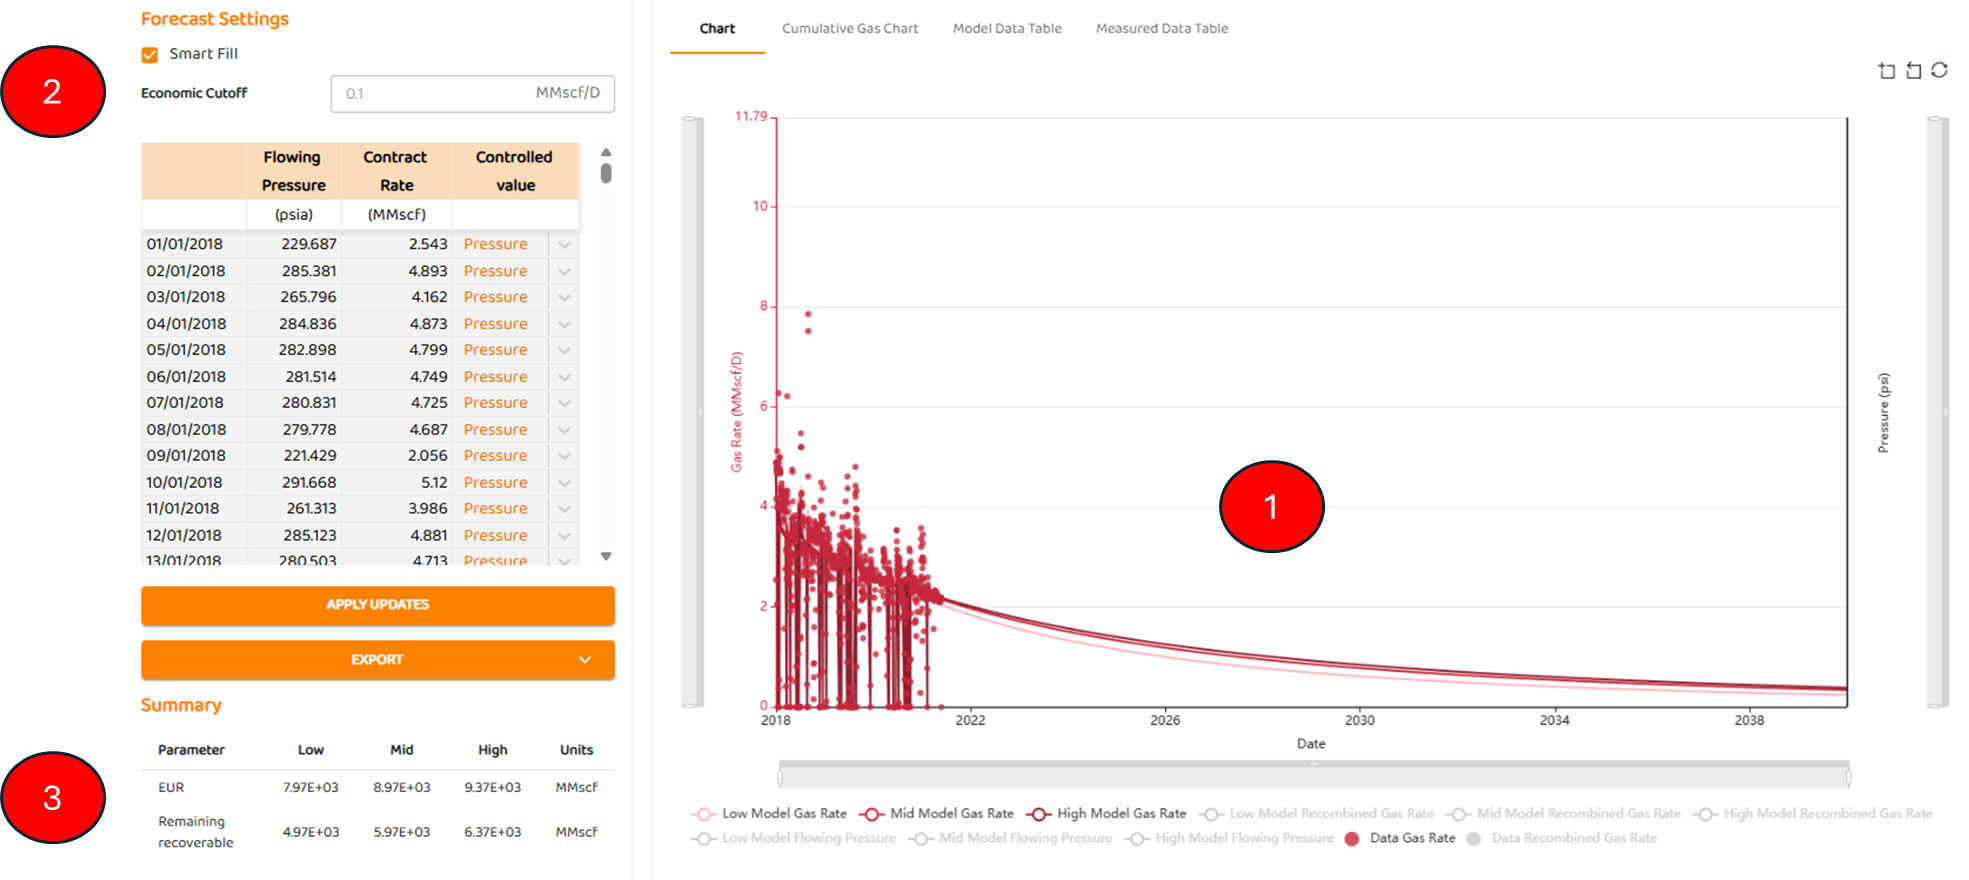
The advanced AFA analytics actually performs and produces three (3) independent forecasts!
See Also:
Further Reading: