
Introduction
In lower permeability reservoirs, short flow and buildup (FBU) times might not produce sufficient data to establish radial flow.
Short-flow transient tests have been reviewed by multiple authors. In lower-permeability reservoirs, pressure-transient tests with short flow periods are very common, and, in unconventional reservoirs, short-flow transient tests are the most-common transient test.
Example 1: Edmonton Sand PTA
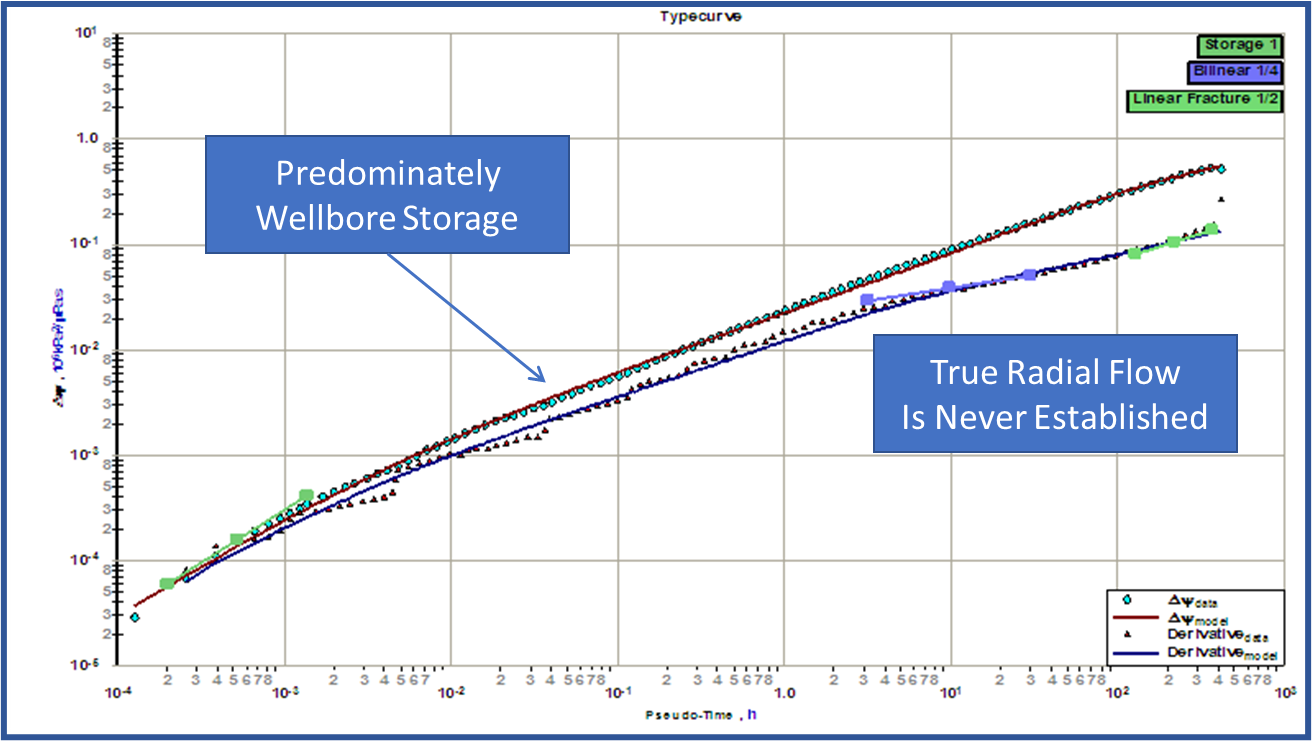
In this example, from moderately shallow Edmonton gas sand, a FBU was conducted. The Bourdet (Well Testing) derivative is shown. The well is stimulated.
Easily observed are:
-
Bilinear flow, followed by
-
Linear flow.
This could be interpreted as a transition from 2D flow to 1D flow as the transient expands further away from the fracture (refer to Hydraulically Fractured Vertical Wells for more detail)
However, RADIAL flow is never seen. An absolute estimate of permeability cannot be easily made.
If we were to assume the late-time data is genuinely representative of radial flow, the solution would be optimistic. However:
The late-time estimate can be considered an upper boundary an upper boundary! Using this information we can purpose the true permeability is lower than a value of X md.
Example 2: Blood Sand PTA
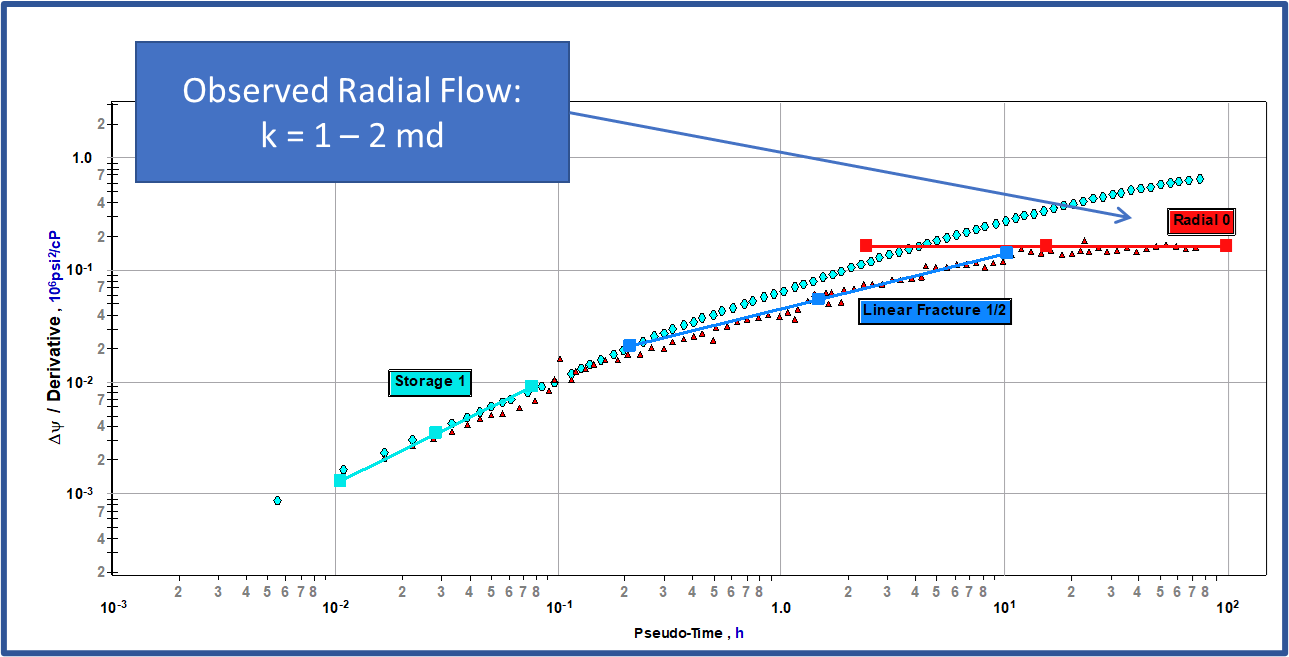
In this example, a FBU was performed on a Canadian gas well. The Bourdet (Well Testing) derivative is shown below.
With approximately 100 hrs of shut-in (estimated from the pseudo-time scale), we see radial flow begins at approximately 10 hrs for a permeability of 1 to 2 md.
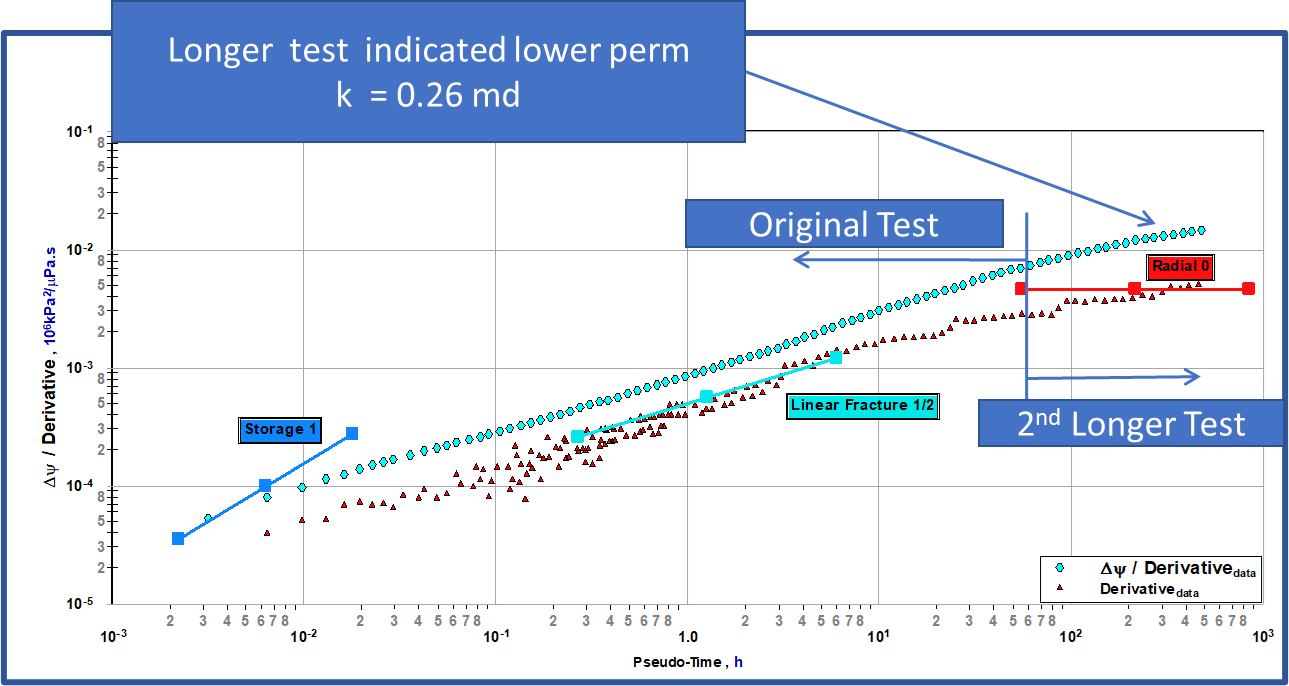
When a second longer test was performed (nearly 1000 hrs), we see that radial flow is not as evident as originally thought.
A “stair-stepping” signature is apparent with more data. Depending on where the test is completed, an analyst could easily interpreted a false radial flow! and provide an optimistic estimate of reservoir flow capacity. The new estimate of permeability is 10x lower than the original estimate.
A false radial flow in this scenario results in an OPTIMISTIC estimate of permeability.
In work by Leif Larsen [2013], it was indicated that when pressure changes fall below the resolution of the gauges, erroneous interpretations can occur. This can occur when pressure values change slowly and/or marginally. Such effects could lead to stair stepping.
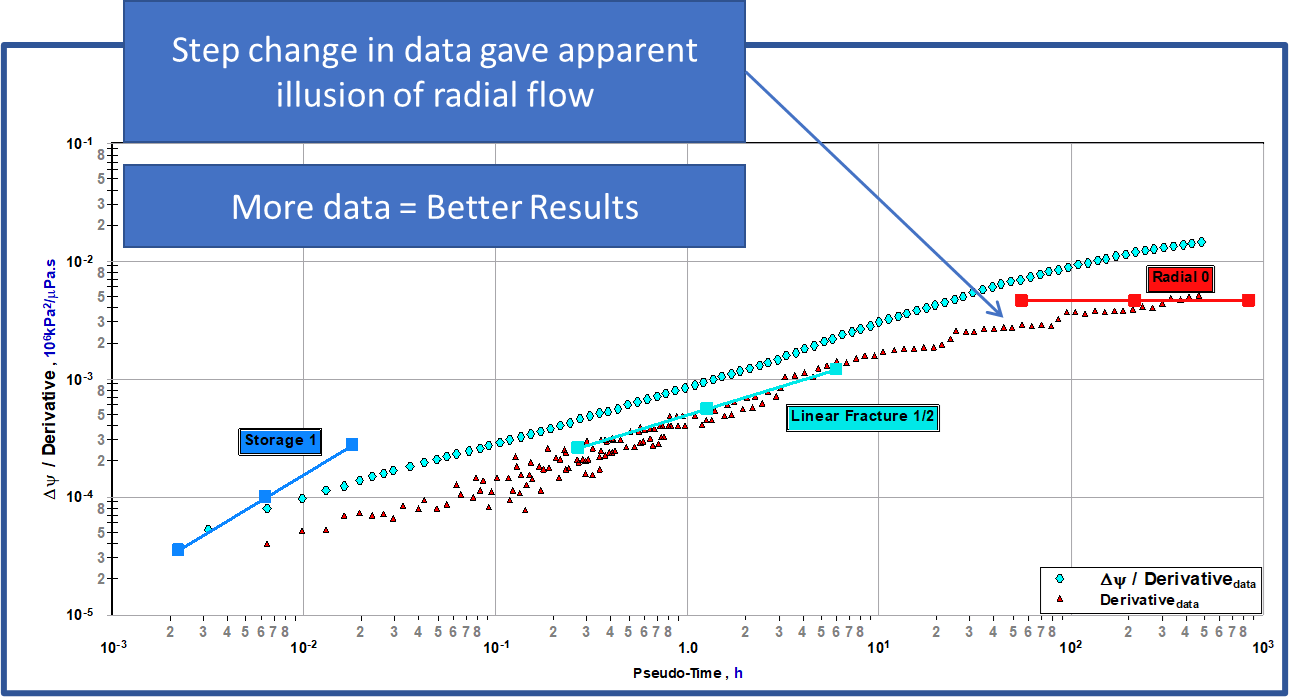
The general conclusion is that more data is always better!
References:
-
Colin Jordan, Robert Jackson, EnCana Short Course: Advanced Flow Analysis, December 2008.
-
Analyses of MDT Pressure-Transient Data Prepared by: Leif Larsen, Rebuttal Expert Report United States v. BP Exploration & Production, et al. 2013.
-
Colin Lyle Jordan, Robert Jackson, Short Course: Complex Well Analyses & Reservoir Engineering Methods for Unconventional Gas, 11th Annual Unconventional Gas Conference, November 20, 2009.
-
“Diagnostic Plots of Pressure-Transient, Rate-Transient, and Diagnostic Fracture Injection/Falloff Tests,” by David Craig, SPE, Occidental, and Thomas Blasingame, SPE, Texas A&M University.