
In this work by Alotaibi et al, they considered linear analysis of fractured horizontal wells in the Eagle Ford Shale (EFS). The plot below, for EFS well 6-H, demonstrates a linear analysis. The authors assumed an Initial Reservoir Pressure of 8,000 psi and a constant BHP of 2,000 psia. This plot follows the method outlined in Hyperbolic (Arps) and Flow Regime Identification
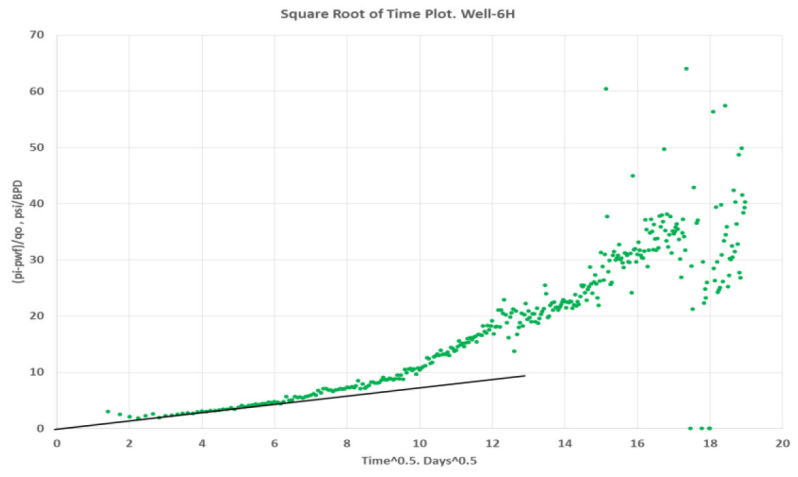
The plot shows that the well produced linear flow for about 6 days (I.e. root of 40) due to the apparent linear flow). In this example, the authors believed the transition away from Linear flow was due to multiphase effects which distorted the idealized linear flow.
References:
-
Basel Alotaibi, David Schechter, and Robert A. Wattenbarger, “Production Forecast, Analysis and Simulation of Eagle Ford Shale Oil Wells”, SPE Middle East Unconventional Resources Conference and Exhibition held in Muscat, Oman, 26 - 28 January 2015.