Introduction
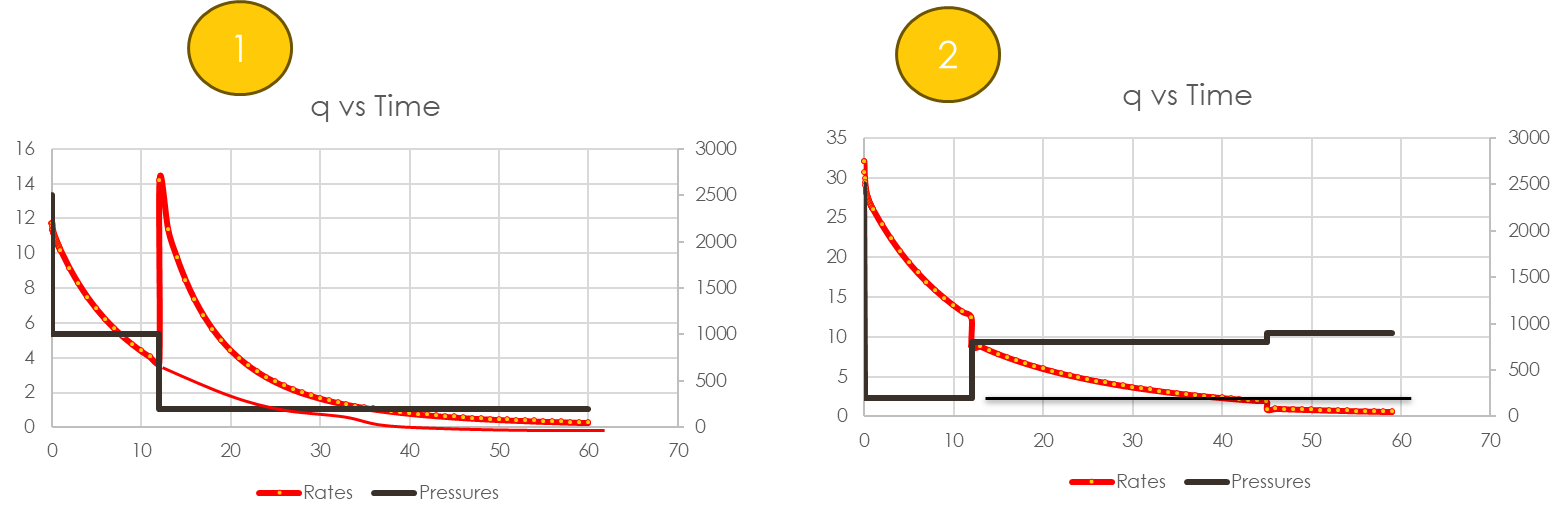
The two plots below show simulated data.
-
As can be seen in the left hand plot, if BHP is suddenly decreased, rates will increase temporarily but continue to decline due to depletion. A new decline trend is established
-
As can be seen in the right hand plot, if BHP is suddenly increased, rates will intravenously drop, and then continue to decline due to depletion. A new decline trend is established.
For normal situations, we should see this type of behavoir.
There are also certain events which should also bed discarded, a good example is that of well cleanup which could is eliminated AFA SPAD decline using Unsupervised Cluster Analysis Option . Other issues which might cause problems may include liquid loading and so on.
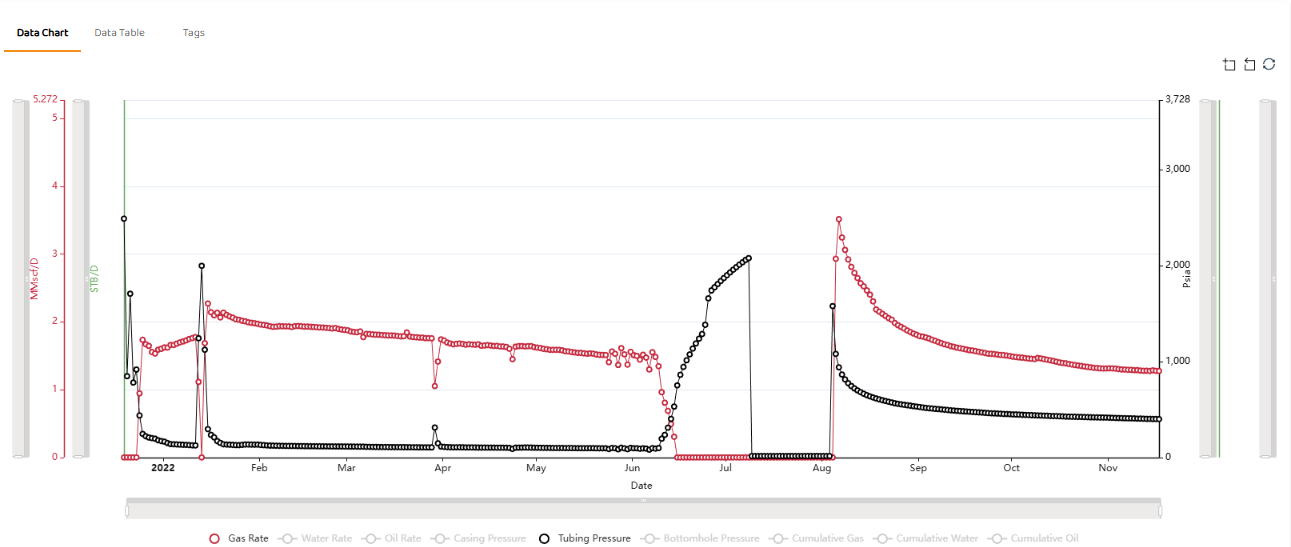
Event Driven Poor Rate-Pressure Correlation
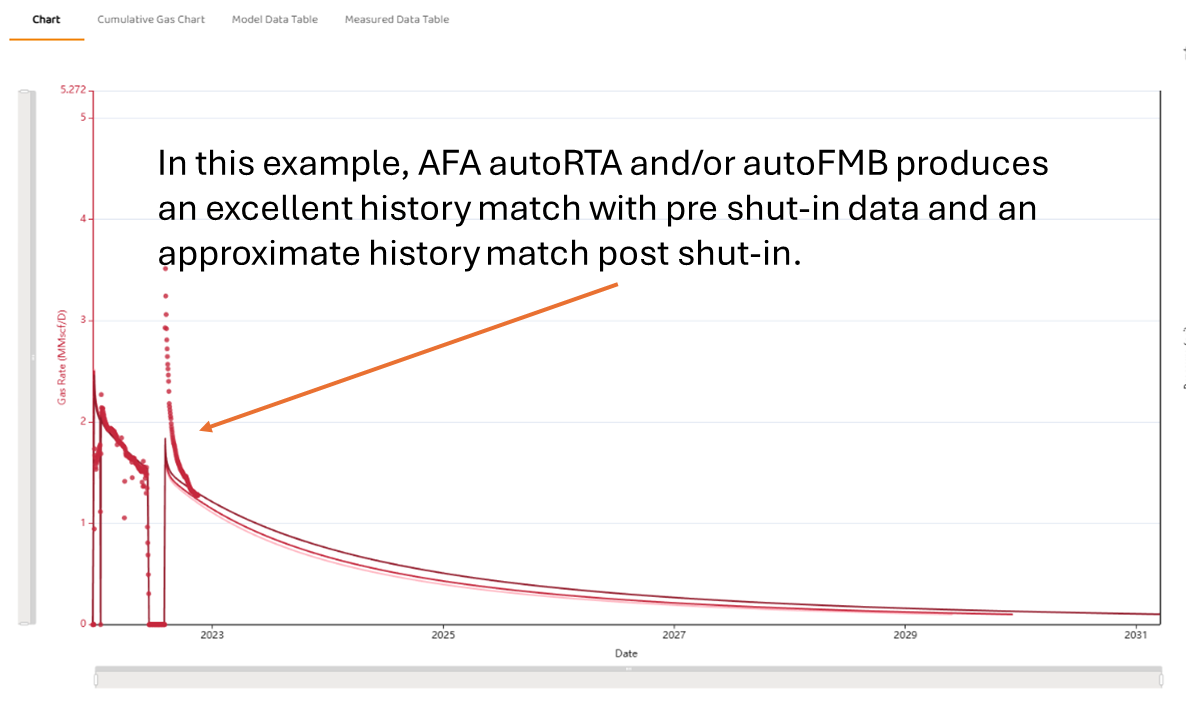
The example below is an example of what “might” be considered poor rate-pressure correlation. Prior to August 2022, relatively low tubing pressures were measured at around 100 psi with rates of 1.1 to 2 MMscf/d. Post August 2022, we see tubing pressures increase from 1000 to about 400 psia (initial pressure is in the order of 3000 psia) which would typically suggest more back-pressure against the formation and hence lower rates; however, rates also increased also increased initially from 3 MMscf/d+ to a more stable value around 1.2 MMscfd/d. Under normal circumstances, this seems odd.
One option is that the data is incorrect. Another option is there was an event such as a recompletion, or production rejuvenation activity. Some of this behaviour is due to pressure build-up in the near wellbore region.
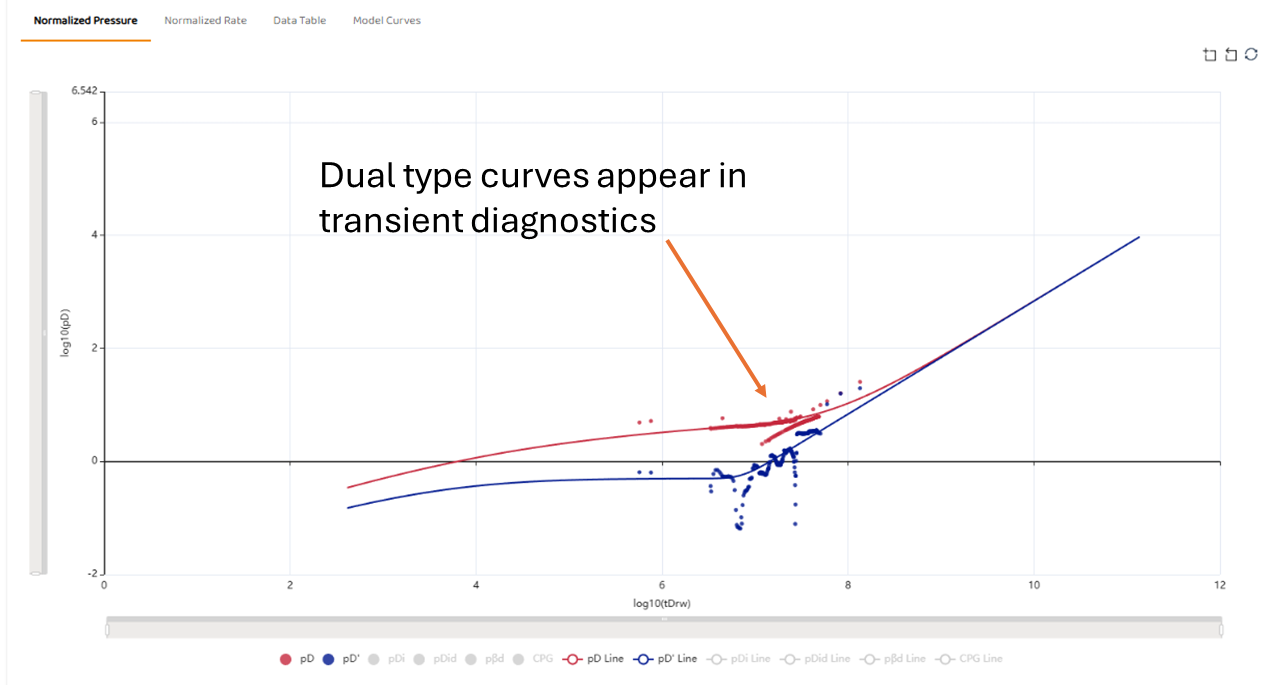
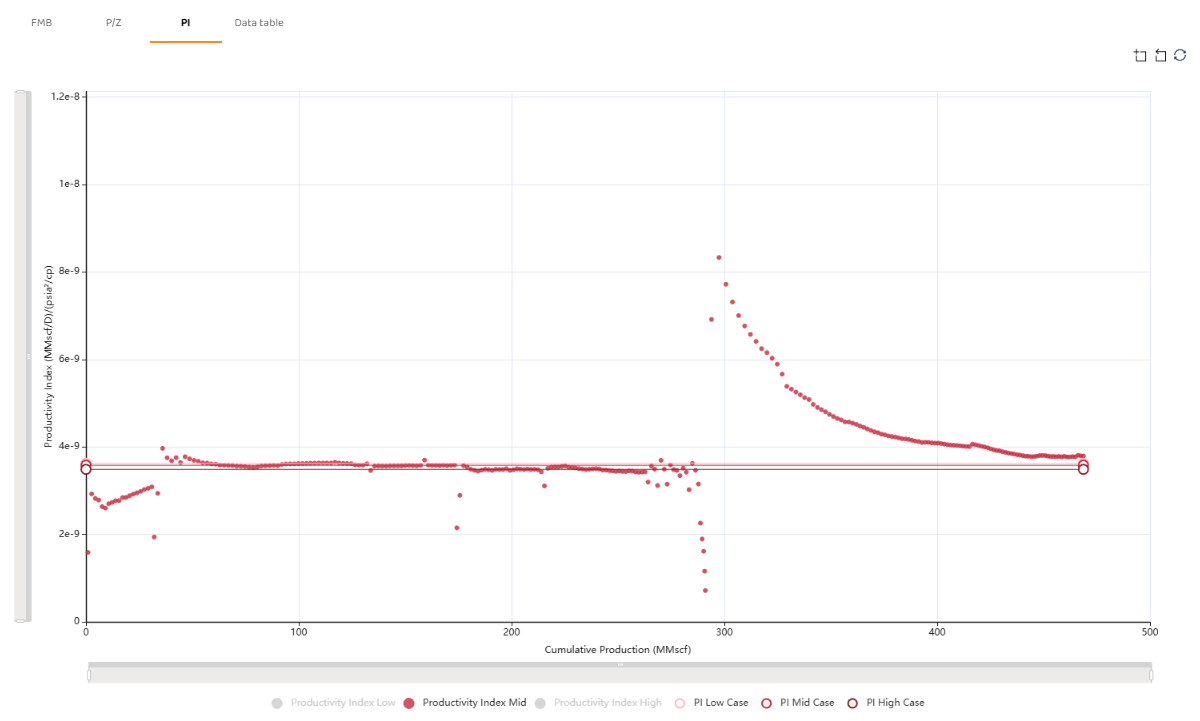
When viewing the typical Bourdet (Well Testing) derivative in the autoRTA module, we see a dual type curve as shown below (which is analogous to different Wellbore Skin and Formation Damage or two different productivity indices). The impact of this event is easily observed in the Productivity Index (PI).
The third image shows the impact of this event change on the history match and production forecast.