
Introduction
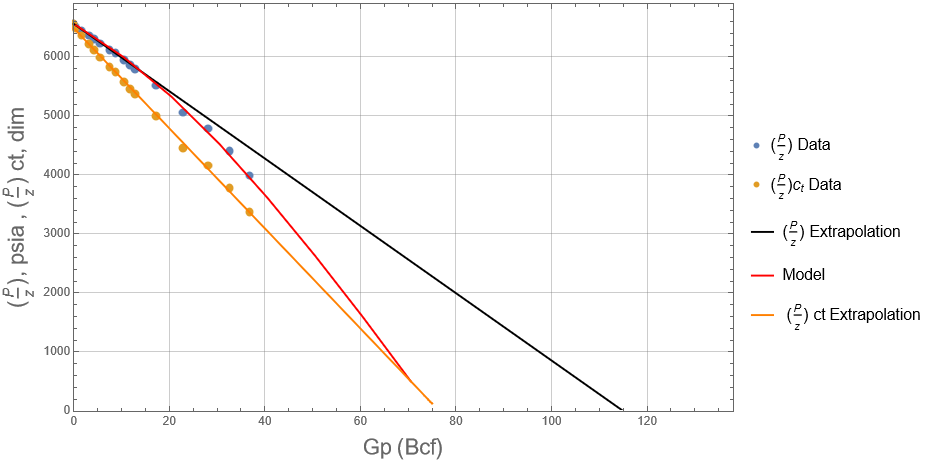
This field example below is the pressure-production Anderson published by Ramaghost and Farshad,. The field data, plotted in blue, shows a non-linear trend when traditional P/z is plotted as Gp. This example is well known and is commonly attributed to the abnormally high pressured reservoirs. The non-linear trend implies that highly optimistic estimates of OGIP, as shown in the black extrapolation, are possible until we observe the second, more downward trend of the data.
Although this can be modelled using an explcit material balance equation shown as shown in red, initial estimates of could still be overly pessmistic until the late-time data.
Following the work of Roach (1981), if we plot (P/z) ct vs Gp, this data can be lineared as shown in orange, and easily extrapolated assuming we know the ct which can be determiened via 1) trial-and-error, or 2) correlations and/or field measurements.
In this example, gas deviation facto r was calculated using the the Dranchuk, Purvis, and Robinson model.
References:
-
Meehan, Tarek AhmedD. Nathan. Advanced Reservoir Management and Engineering, Gulf Professional Publishing.
-
Billy Paul Ramagost, Fred F. Farshad, P/z Abnormally Pressured Gas Reservoirs, 1981, 56th Annual Fall Technnical Conference and Exhibition of the Society of Petroluem Engineers of AIME
-
Roach R.H: “Analyzing Geopressured Reservoirs- A Material-Balance Technique,” paper SPE 9968 available from SPE, Richardson, Texas (1981)