
Most Common Interpretation
“Type Wells” are
-
Type Wells are based on actual well production data and represent a typical production profile for a collection or group of wells for a specified duration.
-
Type Wells are a graphical description of typical production behaviour for a group of wells.
-
Type Wells are a representative production profile of a well for a specific play and/or area.
For instance, the arithmetic average of a group of wells is a common approach to estimate a type well. However, some analysts argue that a geometric average is better at approximating the median.
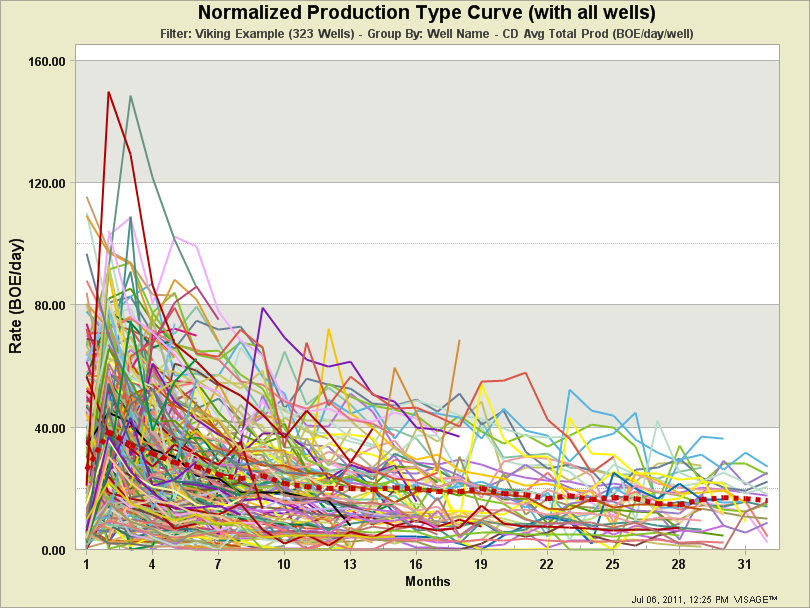
Below is a simple example a type well (thick dotted RED) from the Viking formation in Canada. It is based om 323 wells.
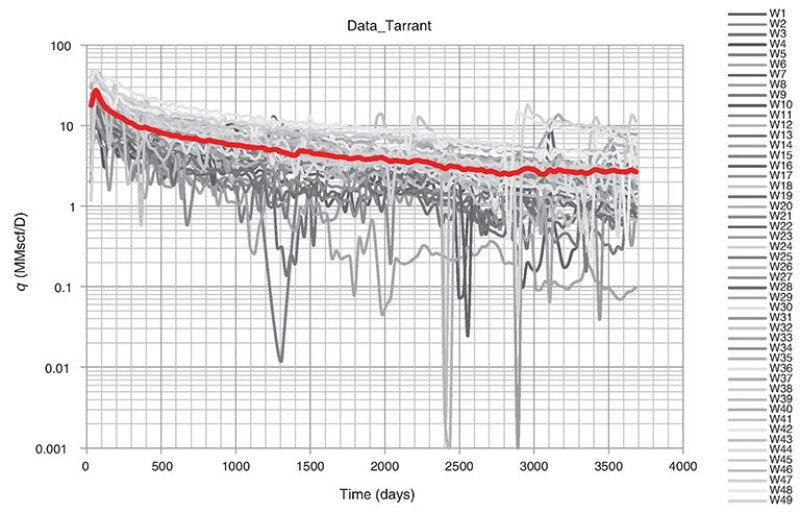
In the plot below, the production profile of 50 Barnett shale wells (Tarrant County) are shown (50 shades of Gray) with their average (red line).
Type wells are often determined from any grouping of wells as listed below:
-
By operator
-
By geological zone
-
Permeability
-
Net Pay
-
-
By Vintage
-
Completion type
-
Frac stages
-
Amount of Proppant
-
Fracture spacing
-
-
Horizontal length
-
Date of first production
-
Drawdown
-
Flowing Pressure
-
Choking policy
-
-
and more!
However common sense must apply when groups. First of all, type wells should be geneated on profiles with similar declines characteristics (use Bins). For instance, consider scaling as comparing the output from lateral lengths of 5,000 ft and 10,000 ft can only be done one a normalized length basis, which is still consisted a large approximation by some experts [Lee, 2015]. Wells that did not produce (zero rates) should also be included as leaving them out overestimates by introducing “survivor basis”
Why Type Wells?
If you were going to drill a successful well in an area, a type curve would be a possible representation of the expected production forecast. However, you will never drill a well that behaves like the type curve, but it does give you a tangible representation of the likely outcome.
Common Uses
-
Reserves evaluations
-
Development planning
-
Production performance comparisons
-
Completion optimization analysis
Limitations of Type Wells
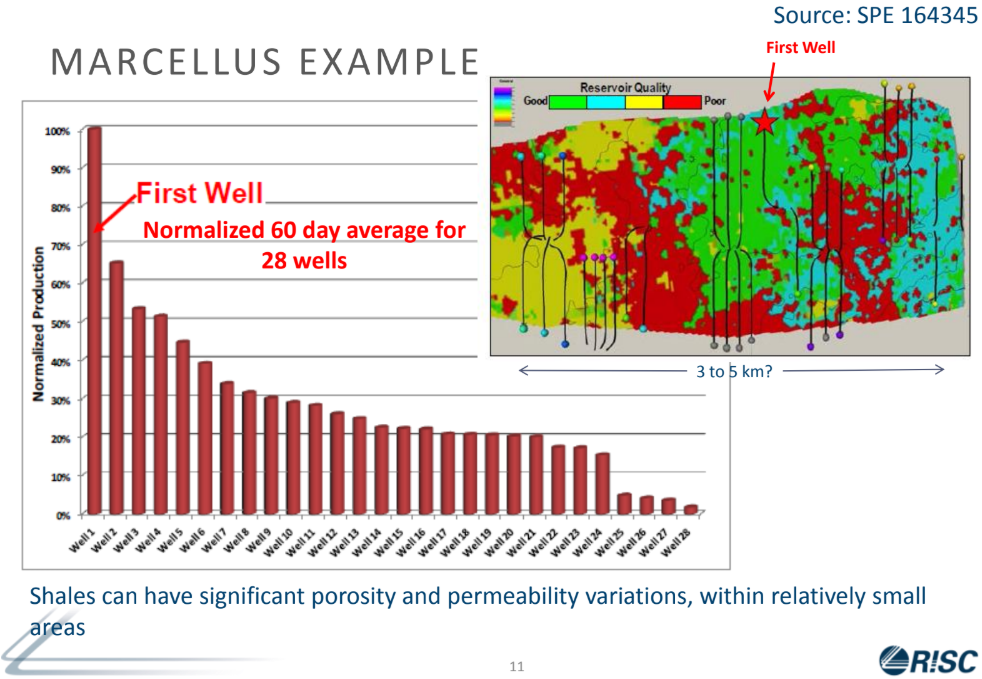
A common flaw of type wells is that the numbers are often higher than reality. Some of that is a reflection of the difficulty in creating a methodology to generalize groups of wells, which sometimes vary widely and unpredictably. In the Marcellus example below [Jordan, XXX], although a laterally continuous play, rock properties can vary widely within very short distances making it hard to find an appropriate bins and groups of wells to generate a type well. A single type well may not represent this data.
A typical well is hard to define in many scenarios, particularly shales which are often laterally continuous but highly heterogeneous
According to SPEE Monograph 3, offset well performance is a not a reliable predictor of location performance. Consequently, predicting the performance of any particular well prior to completion is virtually impossible.
Data-Driven & Model Based Type Wells
A model can also be used to generate a type well. This is the procedure of using a single well (a pseudo well in AFA) model to generate a profile that appears to represent the overall average of the group of wells.
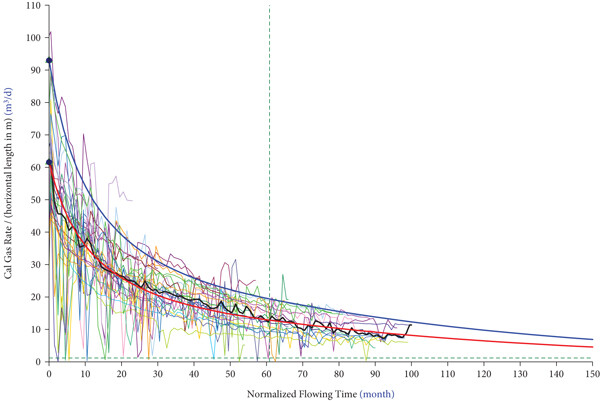
The figure below shows some production data from the Montney Shale in Canada. In this example:
-
The BLACK curve represents the average production rate, normalized to horizontal length. One an argue that this is a data-driven model.
-
The solid RED and BLUE lines represent an average well, from a simulator, using various model parameters
Monte-Carlo and Type Wells
Probabilistic simulation can also be used to generate a type well. In this example, the analyst generates a series of forecasts using coupled Reservoir and Monte-Carlo simulators.
In this example, a CSG project in South Africa, the analyst has a variety of geological and petrophysical information from cores. The simulation was performed an appropriate number of times, and the 50th percentile considered chosen to be representative of a type well for the project area.

See Also:
References:
-
X. Kong, H. Wang, C. Zhang, P. Wang, W. Zhang, RTA-Assisted Type Well Construction in Montney Tight Gas Reservoir from Western Canada Sedimentary Basin. GeoFluids, 22 March 2022
-
SPE 178525 Methodology for Construction of Type Wells for Production Forecasting in Unconventional Reservoirs by Ayush Rastogi and John Lee, University of Houston, 2015.
-
C. Jordan, G. Barker, B. Gunn Evaluating Australian unconventional gas: use and misuse of North American analogues. The APPEA Journal 53, 37-46
-
John Lee, Are All Those Bad Things They’re Saying About Our Production Forecasts in Unconventionals True? Denver Chapter SPEE
-
John Lee, Uncertainty in Type Well Construction? What Uncertainty? 2022 Ryder Scott Reserves Conference May 11, 2022