
Introduction
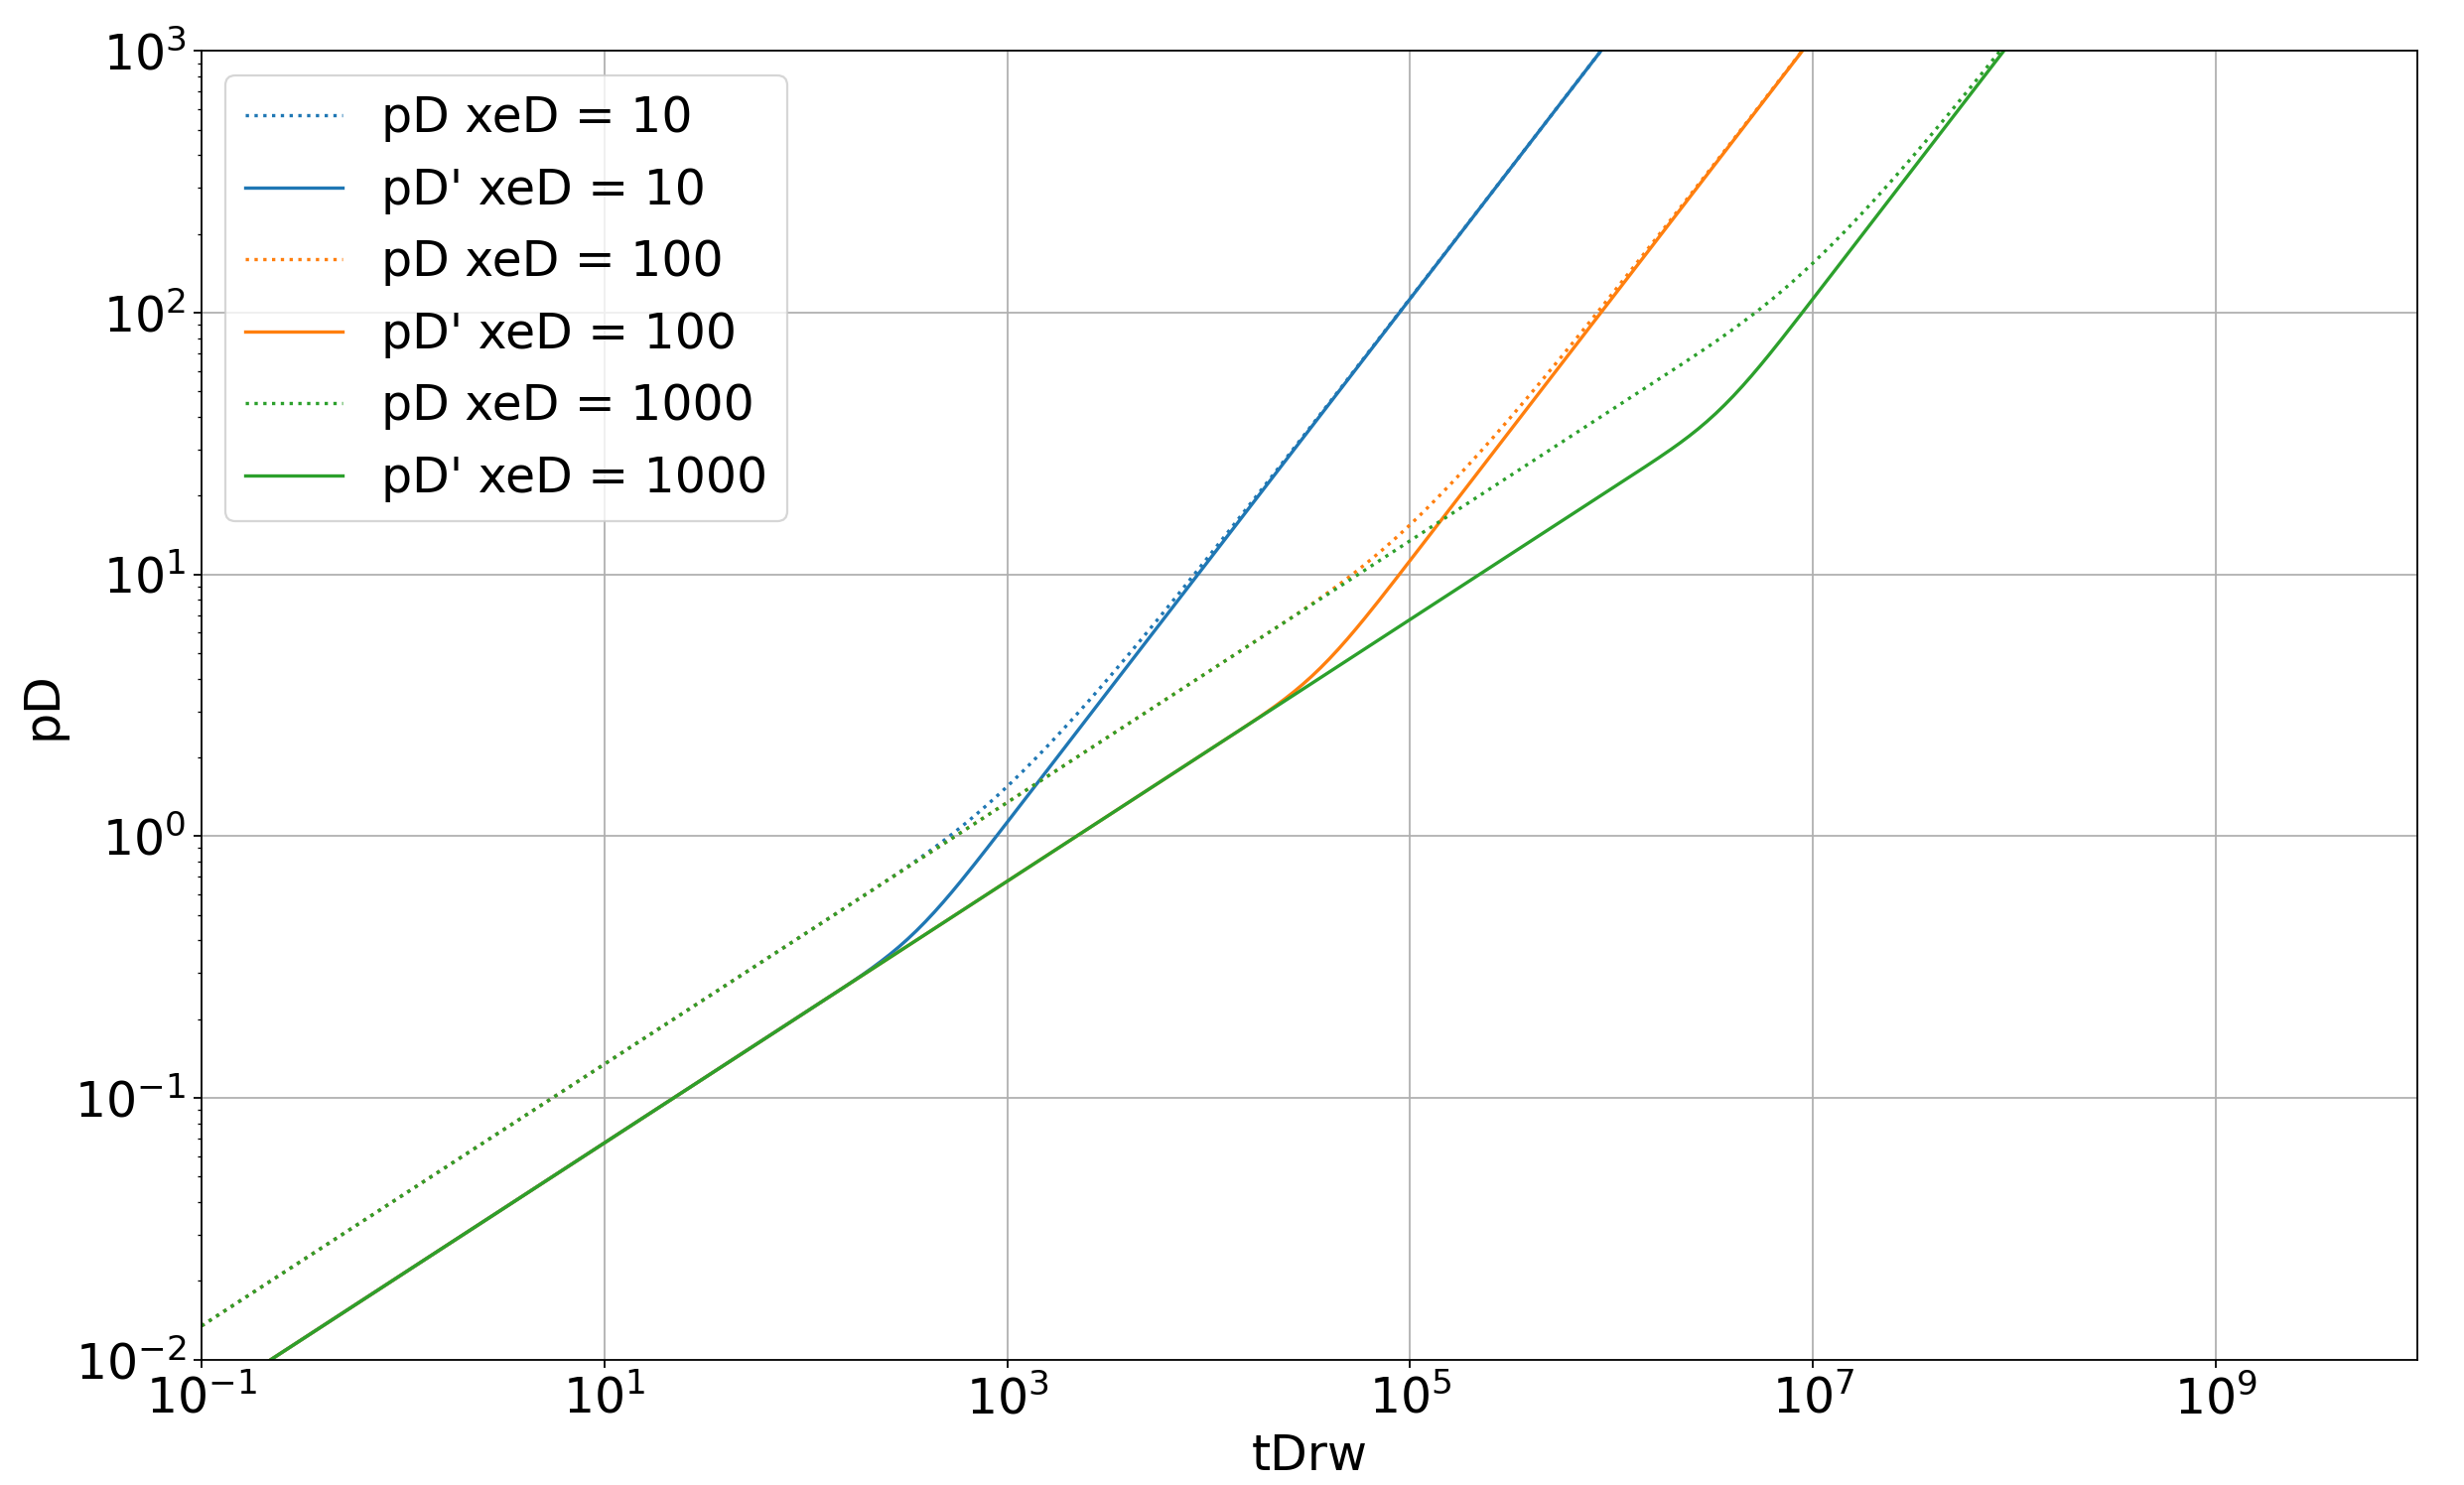
The Bourdet plot typically refers to a log-log plot of the normalized pressure and the Bourdet derivative. the Bourdet derivative is defined as:
|
|
Bourdet Derivative |
%7d=t_%7bD%7d%5ccfrac%7bdp_%7bD%7d%7d%7bdt_%7bD%7d%7d%5cend%7barray%7d%3c/title%3e %3cdefs aria-hidden='true'%3e %3cpath stroke-width='1' id='E1-MJMATHI-70' d='M23 287Q24 290 25 295T30 317T40 348T55 381T75 411T101 433T134 442Q209 442 230 378L240 387Q302 442 358 442Q423 442 460 395T497 281Q497 173 421 82T249 -10Q227 -10 210 -4Q199 1 187 11T168 28L161 36Q160 35 139 -51T118 -138Q118 -144 126 -145T163 -148H188Q194 -155 194 -157T191 -175Q188 -187 185 -190T172 -194Q170 -194 161 -194T127 -193T65 -192Q-5 -192 -24 -194H-32Q-39 -187 -39 -183Q-37 -156 -26 -148H-6Q28 -147 33 -136Q36 -130 94 103T155 350Q156 355 156 364Q156 405 131 405Q109 405 94 377T71 316T59 280Q57 278 43 278H29Q23 284 23 287ZM178 102Q200 26 252 26Q282 26 310 49T356 107Q374 141 392 215T411 325V331Q411 405 350 405Q339 405 328 402T306 393T286 380T269 365T254 350T243 336T235 326L232 322Q232 321 229 308T218 264T204 212Q178 106 178 102Z'%3e%3c/path%3e %3cpath stroke-width='1' id='E1-MJMAIN-2032' d='M79 43Q73 43 52 49T30 61Q30 68 85 293T146 528Q161 560 198 560Q218 560 240 545T262 501Q262 496 260 486Q259 479 173 263T84 45T79 43Z'%3e%3c/path%3e %3cpath stroke-width='1' id='E1-MJMATHI-44' d='M287 628Q287 635 230 637Q207 637 200 638T193 647Q193 655 197 667T204 682Q206 683 403 683Q570 682 590 682T630 676Q702 659 752 597T803 431Q803 275 696 151T444 3L430 1L236 0H125H72Q48 0 41 2T33 11Q33 13 36 25Q40 41 44 43T67 46Q94 46 127 49Q141 52 146 61Q149 65 218 339T287 628ZM703 469Q703 507 692 537T666 584T629 613T590 629T555 636Q553 636 541 636T512 636T479 637H436Q392 637 386 627Q384 623 313 339T242 52Q242 48 253 48T330 47Q335 47 349 47T373 46Q499 46 581 128Q617 164 640 212T683 339T703 469Z'%3e%3c/path%3e %3cpath stroke-width='1' id='E1-MJMAIN-3D' d='M56 347Q56 360 70 367H707Q722 359 722 347Q722 336 708 328L390 327H72Q56 332 56 347ZM56 153Q56 168 72 173H708Q722 163 722 153Q722 140 707 133H70Q56 140 56 153Z'%3e%3c/path%3e %3cpath stroke-width='1' id='E1-MJMATHI-64' d='M366 683Q367 683 438 688T511 694Q523 694 523 686Q523 679 450 384T375 83T374 68Q374 26 402 26Q411 27 422 35Q443 55 463 131Q469 151 473 152Q475 153 483 153H487H491Q506 153 506 145Q506 140 503 129Q490 79 473 48T445 8T417 -8Q409 -10 393 -10Q359 -10 336 5T306 36L300 51Q299 52 296 50Q294 48 292 46Q233 -10 172 -10Q117 -10 75 30T33 157Q33 205 53 255T101 341Q148 398 195 420T280 442Q336 442 364 400Q369 394 369 396Q370 400 396 505T424 616Q424 629 417 632T378 637H357Q351 643 351 645T353 664Q358 683 366 683ZM352 326Q329 405 277 405Q242 405 210 374T160 293Q131 214 119 129Q119 126 119 118T118 106Q118 61 136 44T179 26Q233 26 290 98L298 109L352 326Z'%3e%3c/path%3e %3cpath stroke-width='1' id='E1-MJMAIN-6C' d='M42 46H56Q95 46 103 60V68Q103 77 103 91T103 124T104 167T104 217T104 272T104 329Q104 366 104 407T104 482T104 542T103 586T103 603Q100 622 89 628T44 637H26V660Q26 683 28 683L38 684Q48 685 67 686T104 688Q121 689 141 690T171 693T182 694H185V379Q185 62 186 60Q190 52 198 49Q219 46 247 46H263V0H255L232 1Q209 2 183 2T145 3T107 3T57 1L34 0H26V46H42Z'%3e%3c/path%3e %3cpath stroke-width='1' id='E1-MJMAIN-6E' d='M41 46H55Q94 46 102 60V68Q102 77 102 91T102 122T103 161T103 203Q103 234 103 269T102 328V351Q99 370 88 376T43 385H25V408Q25 431 27 431L37 432Q47 433 65 434T102 436Q119 437 138 438T167 441T178 442H181V402Q181 364 182 364T187 369T199 384T218 402T247 421T285 437Q305 442 336 442Q450 438 463 329Q464 322 464 190V104Q464 66 466 59T477 49Q498 46 526 46H542V0H534L510 1Q487 2 460 2T422 3Q319 3 310 0H302V46H318Q379 46 379 62Q380 64 380 200Q379 335 378 343Q372 371 358 385T334 402T308 404Q263 404 229 370Q202 343 195 315T187 232V168V108Q187 78 188 68T191 55T200 49Q221 46 249 46H265V0H257L234 1Q210 2 183 2T145 3Q42 3 33 0H25V46H41Z'%3e%3c/path%3e %3cpath stroke-width='1' id='E1-MJMAIN-28' d='M94 250Q94 319 104 381T127 488T164 576T202 643T244 695T277 729T302 750H315H319Q333 750 333 741Q333 738 316 720T275 667T226 581T184 443T167 250T184 58T225 -81T274 -167T316 -220T333 -241Q333 -250 318 -250H315H302L274 -226Q180 -141 137 -14T94 250Z'%3e%3c/path%3e %3cpath stroke-width='1' id='E1-MJMATHI-74' d='M26 385Q19 392 19 395Q19 399 22 411T27 425Q29 430 36 430T87 431H140L159 511Q162 522 166 540T173 566T179 586T187 603T197 615T211 624T229 626Q247 625 254 615T261 596Q261 589 252 549T232 470L222 433Q222 431 272 431H323Q330 424 330 420Q330 398 317 385H210L174 240Q135 80 135 68Q135 26 162 26Q197 26 230 60T283 144Q285 150 288 151T303 153H307Q322 153 322 145Q322 142 319 133Q314 117 301 95T267 48T216 6T155 -11Q125 -11 98 4T59 56Q57 64 57 83V101L92 241Q127 382 128 383Q128 385 77 385H26Z'%3e%3c/path%3e %3cpath stroke-width='1' id='E1-MJMAIN-29' d='M60 749L64 750Q69 750 74 750H86L114 726Q208 641 251 514T294 250Q294 182 284 119T261 12T224 -76T186 -143T145 -194T113 -227T90 -246Q87 -249 86 -250H74Q66 -250 63 -250T58 -247T55 -238Q56 -237 66 -225Q221 -64 221 250T66 725Q56 737 55 738Q55 746 60 749Z'%3e%3c/path%3e %3c/defs%3e %3cg stroke='currentColor' fill='currentColor' stroke-width='0' transform='matrix(1 0 0 -1 0 0)' aria-hidden='true'%3e %3cg transform='translate(167%2c0)'%3e %3cg transform='translate(-11%2c0)'%3e %3cuse xlink:href='%23E1-MJMATHI-70' x='0' y='0'%3e%3c/use%3e %3cuse transform='scale(0.707)' xlink:href='%23E1-MJMAIN-2032' x='712' y='445'%3e%3c/use%3e %3cg transform='translate(503%2c-320)'%3e %3cuse transform='scale(0.707)' xlink:href='%23E1-MJMATHI-44' x='0' y='0'%3e%3c/use%3e %3c/g%3e %3cuse xlink:href='%23E1-MJMAIN-3D' x='1467' y='0'%3e%3c/use%3e %3cg transform='translate(2245%2c0)'%3e %3cg transform='translate(397%2c0)'%3e %3crect stroke='none' width='3471' height='60' x='0' y='220'%3e%3c/rect%3e %3cg transform='translate(879%2c819)'%3e %3cg%3e%3c/g%3e %3cuse xlink:href='%23E1-MJMATHI-64' x='0' y='0'%3e%3c/use%3e %3cg transform='translate(523%2c0)'%3e %3cuse xlink:href='%23E1-MJMATHI-70' x='0' y='0'%3e%3c/use%3e %3cuse transform='scale(0.707)' xlink:href='%23E1-MJMATHI-44' x='712' y='-213'%3e%3c/use%3e %3c/g%3e %3c/g%3e %3cg transform='translate(60%2c-880)'%3e %3cg%3e%3c/g%3e %3cuse xlink:href='%23E1-MJMATHI-64' x='0' y='0'%3e%3c/use%3e %3cg transform='translate(690%2c0)'%3e %3cuse xlink:href='%23E1-MJMAIN-6C'%3e%3c/use%3e %3cuse xlink:href='%23E1-MJMAIN-6E' x='278' y='0'%3e%3c/use%3e %3c/g%3e %3cg transform='translate(1525%2c0)'%3e %3cuse xlink:href='%23E1-MJMAIN-28' x='0' y='0'%3e%3c/use%3e %3cg transform='translate(389%2c0)'%3e %3cuse xlink:href='%23E1-MJMATHI-74' x='0' y='0'%3e%3c/use%3e %3cuse transform='scale(0.707)' xlink:href='%23E1-MJMATHI-44' x='511' y='-213'%3e%3c/use%3e %3c/g%3e %3cuse xlink:href='%23E1-MJMAIN-29' x='1436' y='0'%3e%3c/use%3e %3c/g%3e %3c/g%3e %3c/g%3e %3c/g%3e %3cuse xlink:href='%23E1-MJMAIN-3D' x='6512' y='0'%3e%3c/use%3e %3cg transform='translate(7568%2c0)'%3e %3cuse xlink:href='%23E1-MJMATHI-74' x='0' y='0'%3e%3c/use%3e %3cuse transform='scale(0.707)' xlink:href='%23E1-MJMATHI-44' x='511' y='-213'%3e%3c/use%3e %3c/g%3e %3cg transform='translate(8616%2c0)'%3e %3cg transform='translate(120%2c0)'%3e %3crect stroke='none' width='1832' height='60' x='0' y='220'%3e%3c/rect%3e %3cg transform='translate(60%2c819)'%3e %3cg%3e%3c/g%3e %3cuse xlink:href='%23E1-MJMATHI-64' x='0' y='0'%3e%3c/use%3e %3cg transform='translate(523%2c0)'%3e %3cuse xlink:href='%23E1-MJMATHI-70' x='0' y='0'%3e%3c/use%3e %3cuse transform='scale(0.707)' xlink:href='%23E1-MJMATHI-44' x='712' y='-213'%3e%3c/use%3e %3c/g%3e %3c/g%3e %3cg transform='translate(131%2c-880)'%3e %3cg%3e%3c/g%3e %3cuse xlink:href='%23E1-MJMATHI-64' x='0' y='0'%3e%3c/use%3e %3cg transform='translate(523%2c0)'%3e %3cuse xlink:href='%23E1-MJMATHI-74' x='0' y='0'%3e%3c/use%3e %3cuse transform='scale(0.707)' xlink:href='%23E1-MJMATHI-44' x='511' y='-213'%3e%3c/use%3e %3c/g%3e %3c/g%3e %3c/g%3e %3c/g%3e %3c/g%3e %3c/g%3e %3c/g%3e %3c/svg%3e)
|
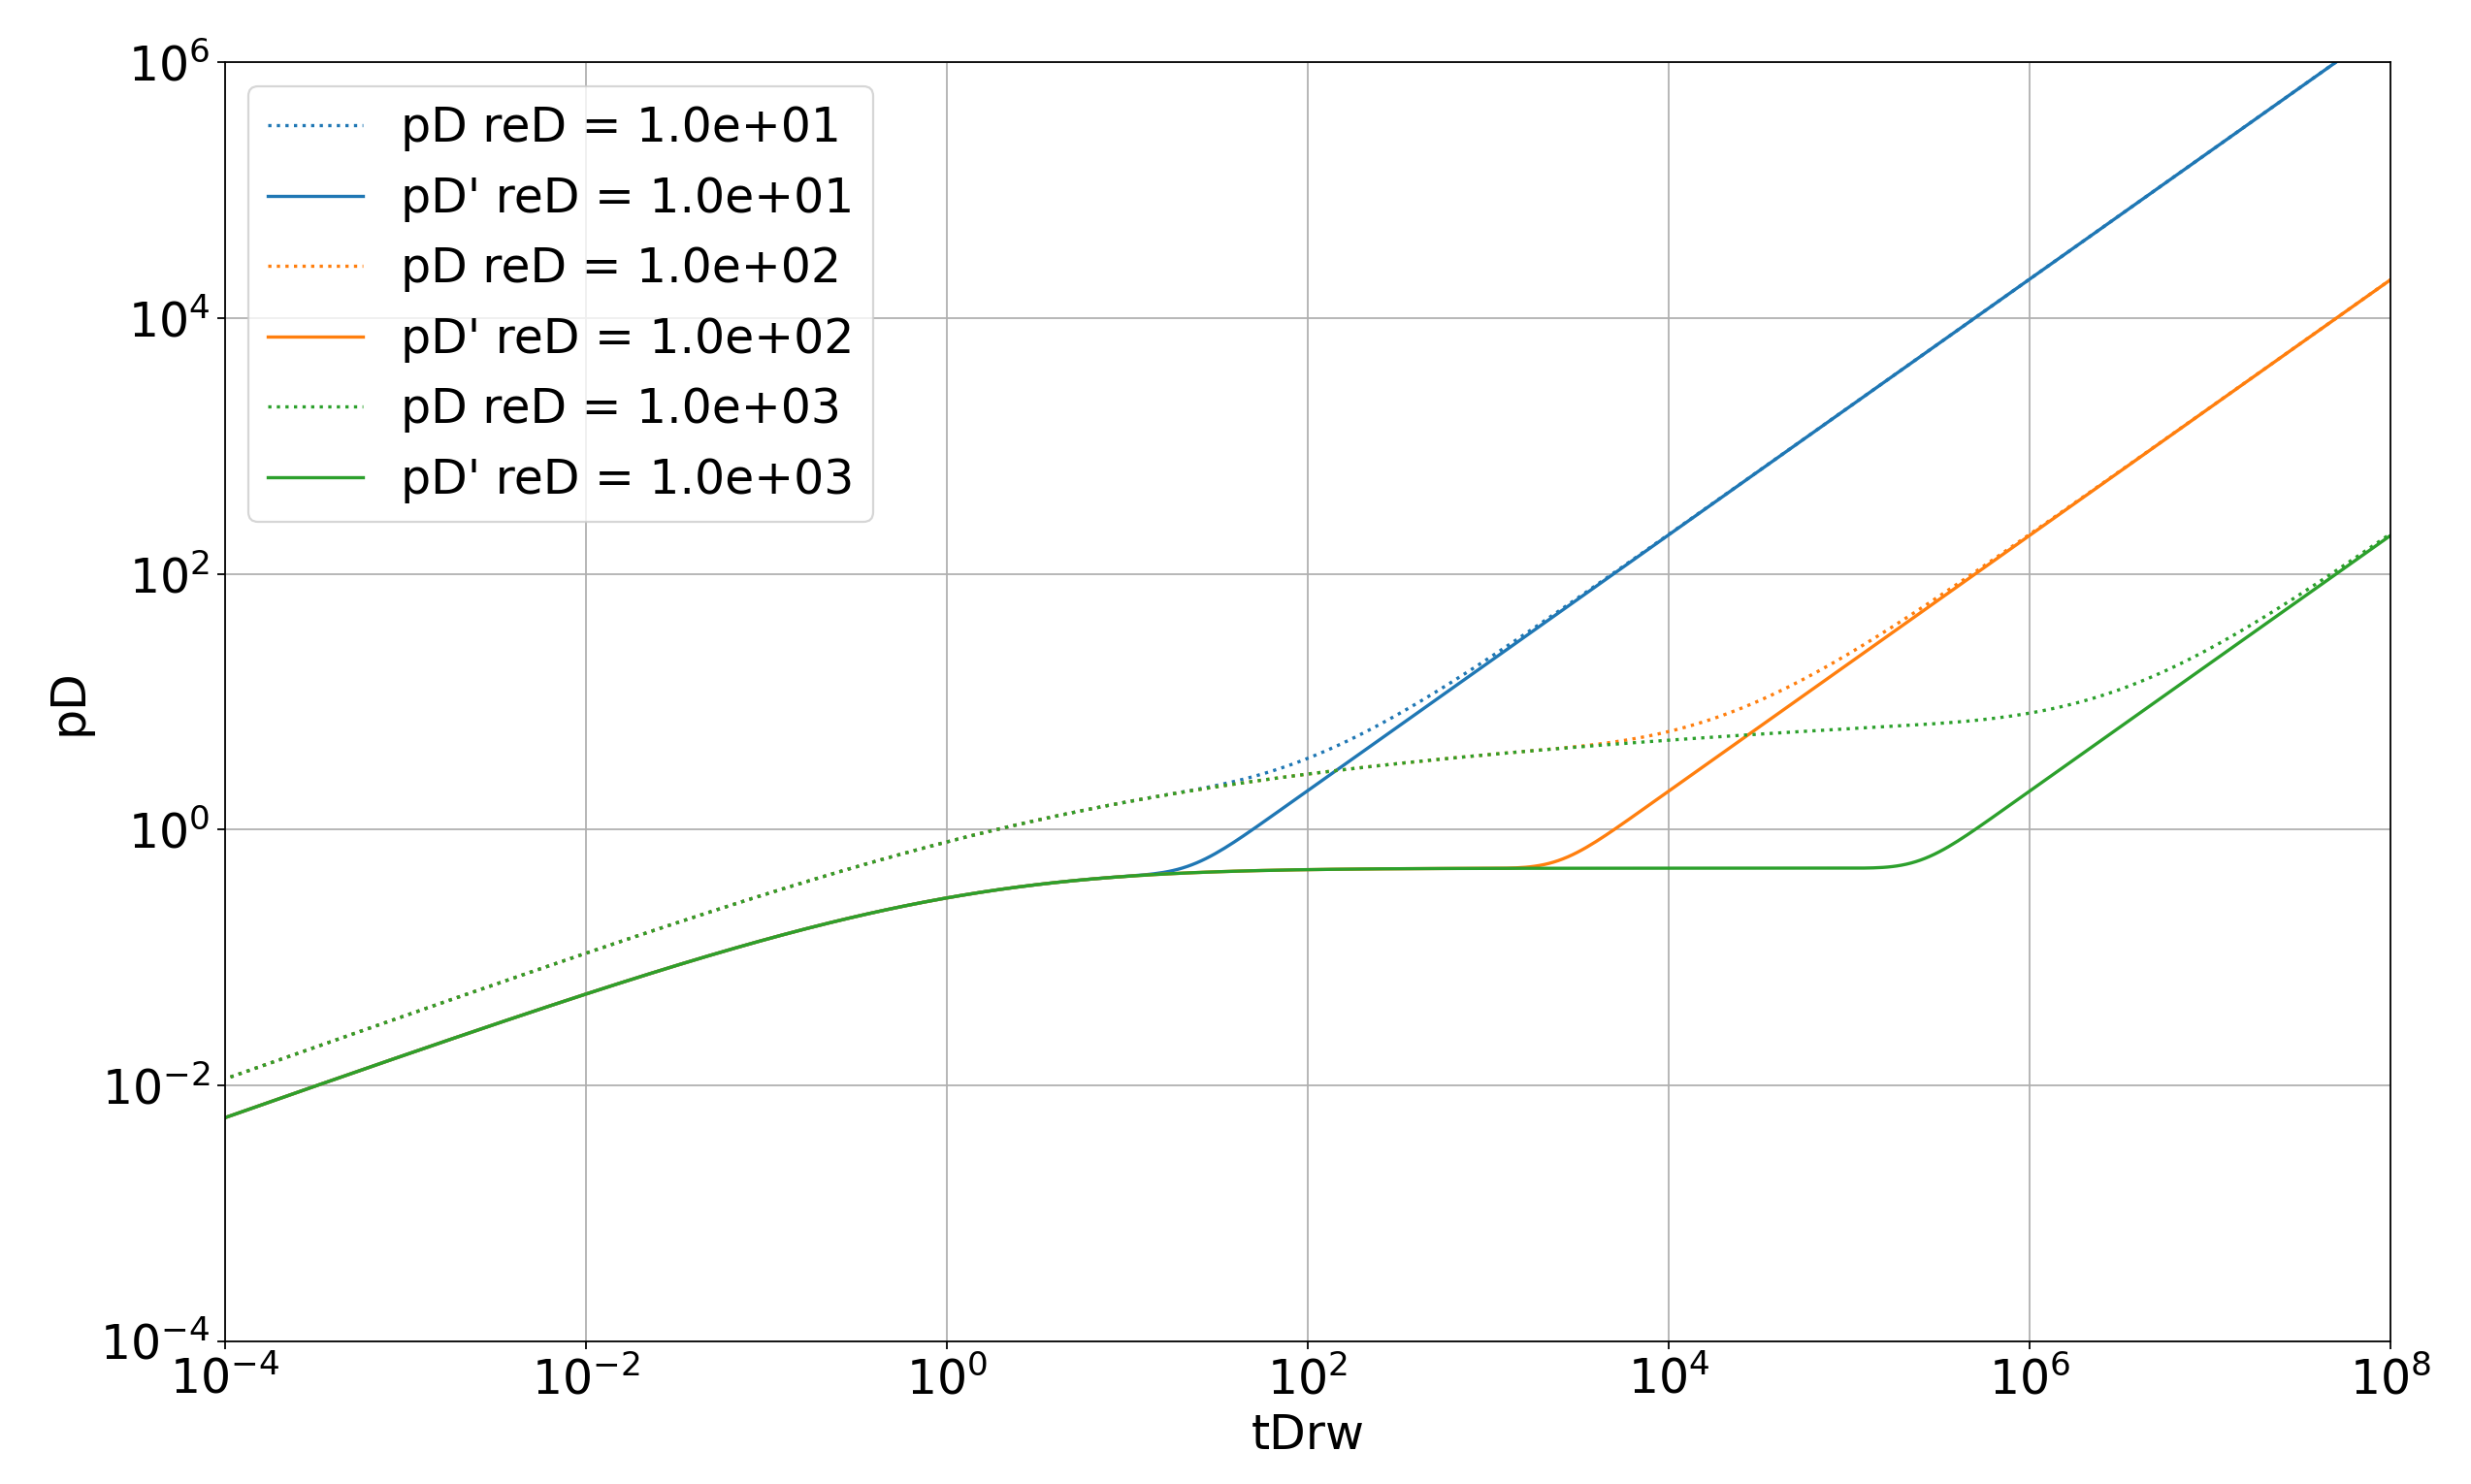
The Bourdet plot is used as it is easy to identify the different flow regimes. The slope of the Bourdet derivative against log time clearly describes the flow regime.
|
Bourdet derivative slope |
Flow Regime |
|---|---|
|
1/2 |
Linear |
|
0 |
Radial |
|
-1/2 |
Spherical |
|
1 |
Boundary-dominated (no flow boundary) |
See Also:
References:
-
Bourdet, Dominique, Ayoub, J. A., and Y. M. Plrard. "Use of Pressure Derivative in Well-Test Interpretation." SPE Form Eval 4 (1989): 293–302.
-
Sowers, S.: The Bourdet Derivative Algorithm Revisited — Introduction and Validation of the Power-Law Derivative Algorithm for Applications in Well-Test Analysis, (internal) B.S. Report, Texas A&M U., College Station, Texas (2005).
-
Mattar, L. and Zaoral, K.: "The Primary Pressure Derivative (PPD) A New Diagnostic Tool in Well Test Interpretation," JCPT, (April 1992), 63-70