
Introduction
In this context, pressure normalized decline is simply rate divided by (Pi-Pwf). This is suggested by John Lee [2013] as the preferred method if BHP or WHP is avaliable (if not full blown FMB and Rate Transient Analysis (RTA))
%7d%7d%5cend%7barray%7d%3c/title%3e %3cdefs aria-hidden='true'%3e %3cpath stroke-width='1' id='E1-MJMAIN-71' d='M33 218Q33 308 95 374T236 441H246Q330 441 381 372L387 364Q388 364 404 403L420 442H457V156Q457 -132 458 -134Q462 -142 470 -145Q491 -148 519 -148H535V-194H527L504 -193Q480 -192 453 -192T415 -191Q312 -191 303 -194H295V-148H311Q339 -148 360 -145Q369 -141 371 -135T373 -106V-41V49Q313 -11 236 -11Q154 -11 94 53T33 218ZM376 300Q346 389 278 401Q275 401 269 401T261 402Q211 400 171 350T131 214Q131 137 165 82T253 27Q296 27 328 54T376 118V300Z'%3e%3c/path%3e %3cpath stroke-width='1' id='E1-MJMAIN-28' d='M94 250Q94 319 104 381T127 488T164 576T202 643T244 695T277 729T302 750H315H319Q333 750 333 741Q333 738 316 720T275 667T226 581T184 443T167 250T184 58T225 -81T274 -167T316 -220T333 -241Q333 -250 318 -250H315H302L274 -226Q180 -141 137 -14T94 250Z'%3e%3c/path%3e %3cpath stroke-width='1' id='E1-MJMAIN-50' d='M130 622Q123 629 119 631T103 634T60 637H27V683H214Q237 683 276 683T331 684Q419 684 471 671T567 616Q624 563 624 489Q624 421 573 372T451 307Q429 302 328 301H234V181Q234 62 237 58Q245 47 304 46H337V0H326Q305 3 182 3Q47 3 38 0H27V46H60Q102 47 111 49T130 61V622ZM507 488Q507 514 506 528T500 564T483 597T450 620T397 635Q385 637 307 637H286Q237 637 234 628Q231 624 231 483V342H302H339Q390 342 423 349T481 382Q507 411 507 488Z'%3e%3c/path%3e %3cpath stroke-width='1' id='E1-MJMAIN-69' d='M69 609Q69 637 87 653T131 669Q154 667 171 652T188 609Q188 579 171 564T129 549Q104 549 87 564T69 609ZM247 0Q232 3 143 3Q132 3 106 3T56 1L34 0H26V46H42Q70 46 91 49Q100 53 102 60T104 102V205V293Q104 345 102 359T88 378Q74 385 41 385H30V408Q30 431 32 431L42 432Q52 433 70 434T106 436Q123 437 142 438T171 441T182 442H185V62Q190 52 197 50T232 46H255V0H247Z'%3e%3c/path%3e %3cpath stroke-width='1' id='E1-MJMAIN-2212' d='M84 237T84 250T98 270H679Q694 262 694 250T679 230H98Q84 237 84 250Z'%3e%3c/path%3e %3cpath stroke-width='1' id='E1-MJMAIN-77' d='M90 368Q84 378 76 380T40 385H18V431H24L43 430Q62 430 84 429T116 428Q206 428 221 431H229V385H215Q177 383 177 368Q177 367 221 239L265 113L339 328L333 345Q323 374 316 379Q308 384 278 385H258V431H264Q270 428 348 428Q439 428 454 431H461V385H452Q404 385 404 369Q404 366 418 324T449 234T481 143L496 100L537 219Q579 341 579 347Q579 363 564 373T530 385H522V431H529Q541 428 624 428Q692 428 698 431H703V385H697Q696 385 691 385T682 384Q635 377 619 334L559 161Q546 124 528 71Q508 12 503 1T487 -11H479Q460 -11 456 -4Q455 -3 407 133L361 267Q359 263 266 -4Q261 -11 243 -11H238Q225 -11 220 -3L90 368Z'%3e%3c/path%3e %3cpath stroke-width='1' id='E1-MJMAIN-66' d='M273 0Q255 3 146 3Q43 3 34 0H26V46H42Q70 46 91 49Q99 52 103 60Q104 62 104 224V385H33V431H104V497L105 564L107 574Q126 639 171 668T266 704Q267 704 275 704T289 705Q330 702 351 679T372 627Q372 604 358 590T321 576T284 590T270 627Q270 647 288 667H284Q280 668 273 668Q245 668 223 647T189 592Q183 572 182 497V431H293V385H185V225Q185 63 186 61T189 57T194 54T199 51T206 49T213 48T222 47T231 47T241 46T251 46H282V0H273Z'%3e%3c/path%3e %3cpath stroke-width='1' id='E1-MJMAIN-29' d='M60 749L64 750Q69 750 74 750H86L114 726Q208 641 251 514T294 250Q294 182 284 119T261 12T224 -76T186 -143T145 -194T113 -227T90 -246Q87 -249 86 -250H74Q66 -250 63 -250T58 -247T55 -238Q56 -237 66 -225Q221 -64 221 250T66 725Q56 737 55 738Q55 746 60 749Z'%3e%3c/path%3e %3c/defs%3e %3cg stroke='currentColor' fill='currentColor' stroke-width='0' transform='matrix(1 0 0 -1 0 0)' aria-hidden='true'%3e %3cg transform='translate(167%2c0)'%3e %3cg transform='translate(-11%2c0)'%3e %3cg transform='translate(0%2c128)'%3e %3cg transform='translate(120%2c0)'%3e %3crect stroke='none' width='3115' height='60' x='0' y='220'%3e%3c/rect%3e %3cuse transform='scale(0.707)' xlink:href='%23E1-MJMAIN-71' x='1934' y='823'%3e%3c/use%3e %3cg transform='translate(60%2c-476)'%3e %3cuse transform='scale(0.707)' xlink:href='%23E1-MJMAIN-28' x='0' y='0'%3e%3c/use%3e %3cg transform='translate(275%2c0)'%3e %3cuse transform='scale(0.707)' xlink:href='%23E1-MJMAIN-50' x='0' y='0'%3e%3c/use%3e %3cuse transform='scale(0.574)' xlink:href='%23E1-MJMAIN-69' x='839' y='-246'%3e%3c/use%3e %3c/g%3e %3cuse transform='scale(0.707)' xlink:href='%23E1-MJMAIN-2212' x='1397' y='0'%3e%3c/use%3e %3cg transform='translate(1538%2c0)'%3e %3cuse transform='scale(0.707)' xlink:href='%23E1-MJMAIN-50' x='0' y='0'%3e%3c/use%3e %3cg transform='translate(481%2c-162)'%3e %3cuse transform='scale(0.574)' xlink:href='%23E1-MJMAIN-77' x='0' y='0'%3e%3c/use%3e %3cuse transform='scale(0.574)' xlink:href='%23E1-MJMAIN-66' x='722' y='0'%3e%3c/use%3e %3c/g%3e %3c/g%3e %3cuse transform='scale(0.707)' xlink:href='%23E1-MJMAIN-29' x='3846' y='0'%3e%3c/use%3e %3c/g%3e %3c/g%3e %3c/g%3e %3c/g%3e %3c/g%3e %3c/g%3e %3c/svg%3e)
In other words, Arp's Decline can be re-cast as:
=%5cfrac%7bq%7d%7b%5cleft(P_%7bi%7d-P_%7bwf%7d%5cright)%7d%5cfrac%7b1%7d%7b%5cleft(1%2bbD_%7bi%7dt%5cright)%5e%7b%5cleft(%5cfrac%7b1%7d%7bb%7d%5cright)%7d%7d%7d%5cend%7barray%7d%3c/title%3e %3cdefs aria-hidden='true'%3e %3cpath stroke-width='1' id='E1-MJMAIN-71' d='M33 218Q33 308 95 374T236 441H246Q330 441 381 372L387 364Q388 364 404 403L420 442H457V156Q457 -132 458 -134Q462 -142 470 -145Q491 -148 519 -148H535V-194H527L504 -193Q480 -192 453 -192T415 -191Q312 -191 303 -194H295V-148H311Q339 -148 360 -145Q369 -141 371 -135T373 -106V-41V49Q313 -11 236 -11Q154 -11 94 53T33 218ZM376 300Q346 389 278 401Q275 401 269 401T261 402Q211 400 171 350T131 214Q131 137 165 82T253 27Q296 27 328 54T376 118V300Z'%3e%3c/path%3e %3cpath stroke-width='1' id='E1-MJMAIN-28' d='M94 250Q94 319 104 381T127 488T164 576T202 643T244 695T277 729T302 750H315H319Q333 750 333 741Q333 738 316 720T275 667T226 581T184 443T167 250T184 58T225 -81T274 -167T316 -220T333 -241Q333 -250 318 -250H315H302L274 -226Q180 -141 137 -14T94 250Z'%3e%3c/path%3e %3cpath stroke-width='1' id='E1-MJMAIN-74' d='M27 422Q80 426 109 478T141 600V615H181V431H316V385H181V241Q182 116 182 100T189 68Q203 29 238 29Q282 29 292 100Q293 108 293 146V181H333V146V134Q333 57 291 17Q264 -10 221 -10Q187 -10 162 2T124 33T105 68T98 100Q97 107 97 248V385H18V422H27Z'%3e%3c/path%3e %3cpath stroke-width='1' id='E1-MJMAIN-29' d='M60 749L64 750Q69 750 74 750H86L114 726Q208 641 251 514T294 250Q294 182 284 119T261 12T224 -76T186 -143T145 -194T113 -227T90 -246Q87 -249 86 -250H74Q66 -250 63 -250T58 -247T55 -238Q56 -237 66 -225Q221 -64 221 250T66 725Q56 737 55 738Q55 746 60 749Z'%3e%3c/path%3e %3cpath stroke-width='1' id='E1-MJMAIN-3D' d='M56 347Q56 360 70 367H707Q722 359 722 347Q722 336 708 328L390 327H72Q56 332 56 347ZM56 153Q56 168 72 173H708Q722 163 722 153Q722 140 707 133H70Q56 140 56 153Z'%3e%3c/path%3e %3cpath stroke-width='1' id='E1-MJMAIN-50' d='M130 622Q123 629 119 631T103 634T60 637H27V683H214Q237 683 276 683T331 684Q419 684 471 671T567 616Q624 563 624 489Q624 421 573 372T451 307Q429 302 328 301H234V181Q234 62 237 58Q245 47 304 46H337V0H326Q305 3 182 3Q47 3 38 0H27V46H60Q102 47 111 49T130 61V622ZM507 488Q507 514 506 528T500 564T483 597T450 620T397 635Q385 637 307 637H286Q237 637 234 628Q231 624 231 483V342H302H339Q390 342 423 349T481 382Q507 411 507 488Z'%3e%3c/path%3e %3cpath stroke-width='1' id='E1-MJMAIN-69' d='M69 609Q69 637 87 653T131 669Q154 667 171 652T188 609Q188 579 171 564T129 549Q104 549 87 564T69 609ZM247 0Q232 3 143 3Q132 3 106 3T56 1L34 0H26V46H42Q70 46 91 49Q100 53 102 60T104 102V205V293Q104 345 102 359T88 378Q74 385 41 385H30V408Q30 431 32 431L42 432Q52 433 70 434T106 436Q123 437 142 438T171 441T182 442H185V62Q190 52 197 50T232 46H255V0H247Z'%3e%3c/path%3e %3cpath stroke-width='1' id='E1-MJMAIN-2212' d='M84 237T84 250T98 270H679Q694 262 694 250T679 230H98Q84 237 84 250Z'%3e%3c/path%3e %3cpath stroke-width='1' id='E1-MJMAIN-77' d='M90 368Q84 378 76 380T40 385H18V431H24L43 430Q62 430 84 429T116 428Q206 428 221 431H229V385H215Q177 383 177 368Q177 367 221 239L265 113L339 328L333 345Q323 374 316 379Q308 384 278 385H258V431H264Q270 428 348 428Q439 428 454 431H461V385H452Q404 385 404 369Q404 366 418 324T449 234T481 143L496 100L537 219Q579 341 579 347Q579 363 564 373T530 385H522V431H529Q541 428 624 428Q692 428 698 431H703V385H697Q696 385 691 385T682 384Q635 377 619 334L559 161Q546 124 528 71Q508 12 503 1T487 -11H479Q460 -11 456 -4Q455 -3 407 133L361 267Q359 263 266 -4Q261 -11 243 -11H238Q225 -11 220 -3L90 368Z'%3e%3c/path%3e %3cpath stroke-width='1' id='E1-MJMAIN-66' d='M273 0Q255 3 146 3Q43 3 34 0H26V46H42Q70 46 91 49Q99 52 103 60Q104 62 104 224V385H33V431H104V497L105 564L107 574Q126 639 171 668T266 704Q267 704 275 704T289 705Q330 702 351 679T372 627Q372 604 358 590T321 576T284 590T270 627Q270 647 288 667H284Q280 668 273 668Q245 668 223 647T189 592Q183 572 182 497V431H293V385H185V225Q185 63 186 61T189 57T194 54T199 51T206 49T213 48T222 47T231 47T241 46T251 46H282V0H273Z'%3e%3c/path%3e %3cpath stroke-width='1' id='E1-MJMAIN-31' d='M213 578L200 573Q186 568 160 563T102 556H83V602H102Q149 604 189 617T245 641T273 663Q275 666 285 666Q294 666 302 660V361L303 61Q310 54 315 52T339 48T401 46H427V0H416Q395 3 257 3Q121 3 100 0H88V46H114Q136 46 152 46T177 47T193 50T201 52T207 57T213 61V578Z'%3e%3c/path%3e %3cpath stroke-width='1' id='E1-MJMAIN-2B' d='M56 237T56 250T70 270H369V420L370 570Q380 583 389 583Q402 583 409 568V270H707Q722 262 722 250T707 230H409V-68Q401 -82 391 -82H389H387Q375 -82 369 -68V230H70Q56 237 56 250Z'%3e%3c/path%3e %3cpath stroke-width='1' id='E1-MJMAIN-62' d='M307 -11Q234 -11 168 55L158 37Q156 34 153 28T147 17T143 10L138 1L118 0H98V298Q98 599 97 603Q94 622 83 628T38 637H20V660Q20 683 22 683L32 684Q42 685 61 686T98 688Q115 689 135 690T165 693T176 694H179V543Q179 391 180 391L183 394Q186 397 192 401T207 411T228 421T254 431T286 439T323 442Q401 442 461 379T522 216Q522 115 458 52T307 -11ZM182 98Q182 97 187 90T196 79T206 67T218 55T233 44T250 35T271 29T295 26Q330 26 363 46T412 113Q424 148 424 212Q424 287 412 323Q385 405 300 405Q270 405 239 390T188 347L182 339V98Z'%3e%3c/path%3e %3cpath stroke-width='1' id='E1-MJMAIN-44' d='M130 622Q123 629 119 631T103 634T60 637H27V683H228Q399 682 419 682T461 676Q504 667 546 641T626 573T685 470T708 336Q708 210 634 116T442 3Q429 1 228 0H27V46H60Q102 47 111 49T130 61V622ZM593 338Q593 439 571 501T493 602Q439 637 355 637H322H294Q238 637 234 628Q231 624 231 344Q231 62 232 59Q233 49 248 48T339 46H350Q456 46 515 95Q561 133 577 191T593 338Z'%3e%3c/path%3e %3cpath stroke-width='1' id='E1-MJSZ3-28' d='M701 -940Q701 -943 695 -949H664Q662 -947 636 -922T591 -879T537 -818T475 -737T412 -636T350 -511T295 -362T250 -186T221 17T209 251Q209 962 573 1361Q596 1386 616 1405T649 1437T664 1450H695Q701 1444 701 1441Q701 1436 681 1415T629 1356T557 1261T476 1118T400 927T340 675T308 359Q306 321 306 250Q306 -139 400 -430T690 -924Q701 -936 701 -940Z'%3e%3c/path%3e %3cpath stroke-width='1' id='E1-MJSZ3-29' d='M34 1438Q34 1446 37 1448T50 1450H56H71Q73 1448 99 1423T144 1380T198 1319T260 1238T323 1137T385 1013T440 864T485 688T514 485T526 251Q526 134 519 53Q472 -519 162 -860Q139 -885 119 -904T86 -936T71 -949H56Q43 -949 39 -947T34 -937Q88 -883 140 -813Q428 -430 428 251Q428 453 402 628T338 922T245 1146T145 1309T46 1425Q44 1427 42 1429T39 1433T36 1436L34 1438Z'%3e%3c/path%3e %3c/defs%3e %3cg stroke='currentColor' fill='currentColor' stroke-width='0' transform='matrix(1 0 0 -1 0 0)' aria-hidden='true'%3e %3cg transform='translate(167%2c0)'%3e %3cg transform='translate(-11%2c0)'%3e %3cg transform='translate(0%2c579)'%3e %3cuse xlink:href='%23E1-MJMAIN-71' x='0' y='0'%3e%3c/use%3e %3cg transform='translate(702%2c0)'%3e %3cuse xlink:href='%23E1-MJMAIN-28' x='0' y='0'%3e%3c/use%3e %3cuse xlink:href='%23E1-MJMAIN-74' x='389' y='0'%3e%3c/use%3e %3cuse xlink:href='%23E1-MJMAIN-29' x='779' y='0'%3e%3c/use%3e %3c/g%3e %3cuse xlink:href='%23E1-MJMAIN-3D' x='2148' y='0'%3e%3c/use%3e %3cg transform='translate(2926%2c0)'%3e %3cg transform='translate(397%2c0)'%3e %3crect stroke='none' width='3115' height='60' x='0' y='220'%3e%3c/rect%3e %3cuse transform='scale(0.707)' xlink:href='%23E1-MJMAIN-71' x='1934' y='823'%3e%3c/use%3e %3cg transform='translate(60%2c-476)'%3e %3cuse transform='scale(0.707)' xlink:href='%23E1-MJMAIN-28' x='0' y='0'%3e%3c/use%3e %3cg transform='translate(275%2c0)'%3e %3cuse transform='scale(0.707)' xlink:href='%23E1-MJMAIN-50' x='0' y='0'%3e%3c/use%3e %3cuse transform='scale(0.574)' xlink:href='%23E1-MJMAIN-69' x='839' y='-246'%3e%3c/use%3e %3c/g%3e %3cuse transform='scale(0.707)' xlink:href='%23E1-MJMAIN-2212' x='1397' y='0'%3e%3c/use%3e %3cg transform='translate(1538%2c0)'%3e %3cuse transform='scale(0.707)' xlink:href='%23E1-MJMAIN-50' x='0' y='0'%3e%3c/use%3e %3cg transform='translate(481%2c-162)'%3e %3cuse transform='scale(0.574)' xlink:href='%23E1-MJMAIN-77' x='0' y='0'%3e%3c/use%3e %3cuse transform='scale(0.574)' xlink:href='%23E1-MJMAIN-66' x='722' y='0'%3e%3c/use%3e %3c/g%3e %3c/g%3e %3cuse transform='scale(0.707)' xlink:href='%23E1-MJMAIN-29' x='3846' y='0'%3e%3c/use%3e %3c/g%3e %3c/g%3e %3c/g%3e %3cg transform='translate(6559%2c0)'%3e %3cg transform='translate(120%2c0)'%3e %3crect stroke='none' width='4611' height='60' x='0' y='220'%3e%3c/rect%3e %3cuse transform='scale(0.707)' xlink:href='%23E1-MJMAIN-31' x='3010' y='629'%3e%3c/use%3e %3cg transform='translate(60%2c-1400)'%3e %3cuse transform='scale(0.707)' xlink:href='%23E1-MJMAIN-28' x='0' y='0'%3e%3c/use%3e %3cuse transform='scale(0.707)' xlink:href='%23E1-MJMAIN-31' x='389' y='0'%3e%3c/use%3e %3cuse transform='scale(0.707)' xlink:href='%23E1-MJMAIN-2B' x='890' y='0'%3e%3c/use%3e %3cuse transform='scale(0.707)' xlink:href='%23E1-MJMAIN-62' x='1668' y='0'%3e%3c/use%3e %3cg transform='translate(1573%2c0)'%3e %3cuse transform='scale(0.707)' xlink:href='%23E1-MJMAIN-44' x='0' y='0'%3e%3c/use%3e %3cuse transform='scale(0.574)' xlink:href='%23E1-MJMAIN-69' x='941' y='-246'%3e%3c/use%3e %3c/g%3e %3cuse transform='scale(0.707)' xlink:href='%23E1-MJMAIN-74' x='3315' y='0'%3e%3c/use%3e %3cuse transform='scale(0.707)' xlink:href='%23E1-MJMAIN-29' x='3705' y='0'%3e%3c/use%3e %3cg transform='translate(2895%2c621)'%3e %3cuse transform='scale(0.574)' xlink:href='%23E1-MJSZ3-28'%3e%3c/use%3e %3cg transform='translate(422%2c0)'%3e %3cg transform='translate(120%2c0)'%3e %3crect stroke='none' width='439' height='60' x='0' y='113'%3e%3c/rect%3e %3cuse transform='scale(0.574)' xlink:href='%23E1-MJMAIN-31' x='132' y='589'%3e%3c/use%3e %3cuse transform='scale(0.574)' xlink:href='%23E1-MJMAIN-62' x='104' y='-785'%3e%3c/use%3e %3c/g%3e %3c/g%3e %3cuse transform='scale(0.574)' xlink:href='%23E1-MJSZ3-29' x='1920' y='-1'%3e%3c/use%3e %3c/g%3e %3c/g%3e %3c/g%3e %3c/g%3e %3c/g%3e %3c/g%3e %3c/g%3e %3c/g%3e %3c/svg%3e)
The above can also be applied to other models discussed in Decline for Unconventional Reservoirs (refer to Collins [2016]) for additional discussion.
Although similar in concept, this is a simplification than the normalized rate and pressure variables used in FMB and Rate Transient Analysis (RTA) and Transient Models & Flow Regimes - both which take into account fluid and rock properties, in addition to flowing pressure. It is an attempt to provide a “constant pressure” rate response so decline curve analysis can be performed.
It is worth to note that the pressure drop normalization serves only as an approximation, and it is not exact
Practical Advantages of Pressure Normalized Decline
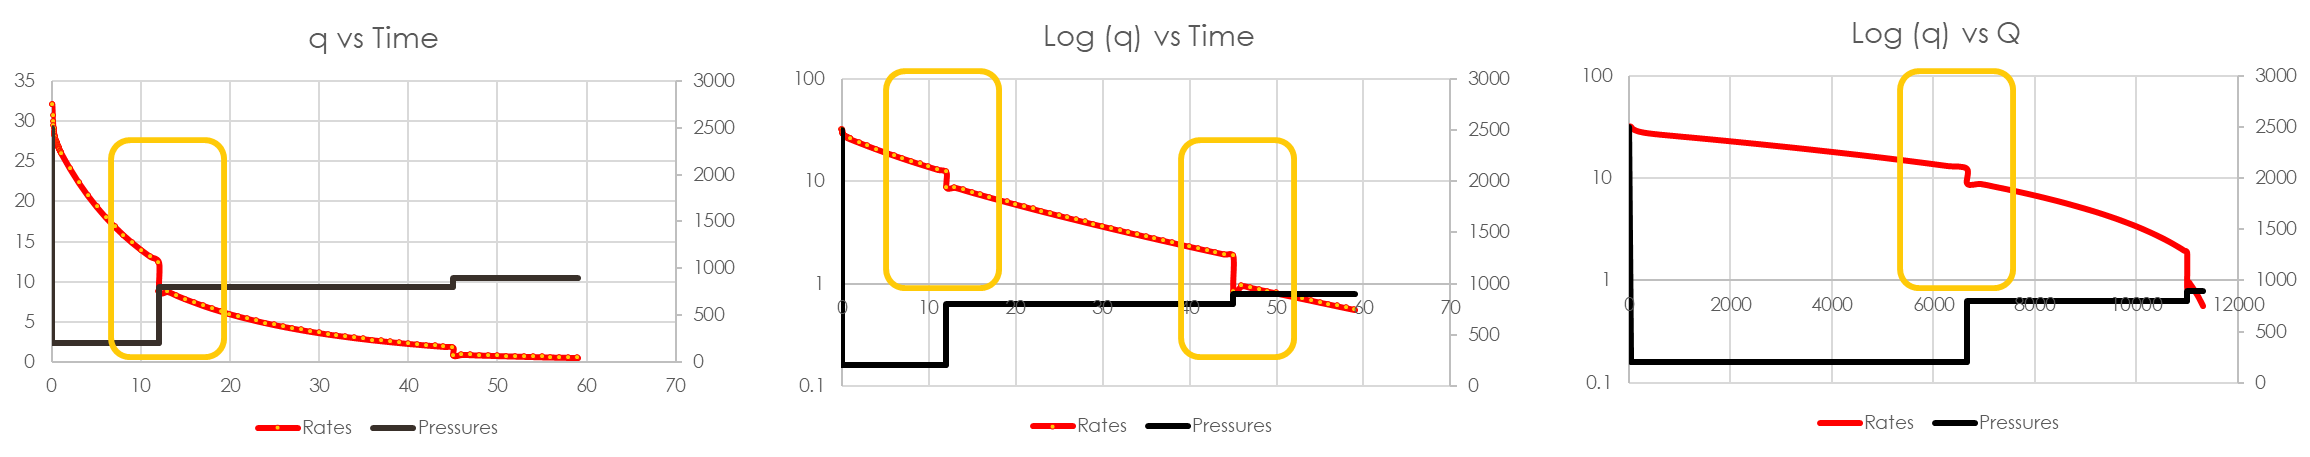
For demonstration, a decline was simulated for a gas well within a homogeneous bounded reservoir (and included some BHP pressure changes). Some of the more common decline plots are shown below. With each bottomhole pressure change, we see a corresponding rate change. This may pose difficulty for automated decline analysis if rates are changing often due to BHP changes.
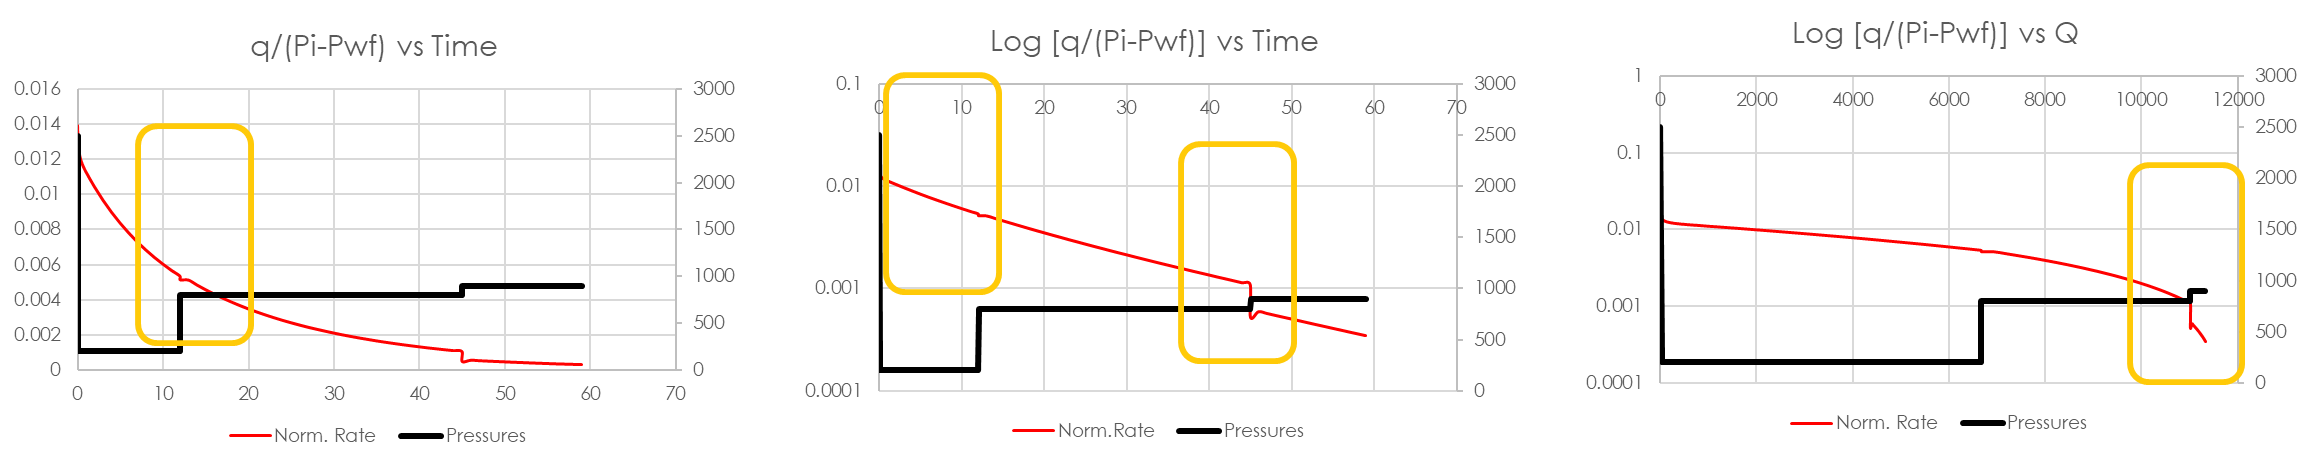
Using a normalized decline is shown below. On many of the plots, the magnitude of the rate change is reduced - the plots become smoother! The greatest impact was seen on the two (2) left plots.
This is a common technique to normalize the data for operational conditions.
According to Ilk [2023], it is worth noting that pressure drop normalization serves as only an approximation in traditional decline analysis (it is not exact).
Pressure Normalized Decline & Flow Regime Identification
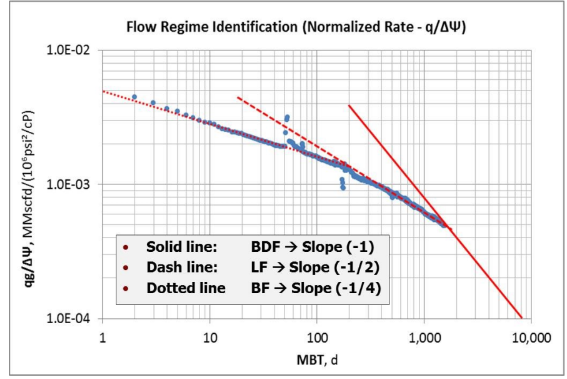
John Seidle [2017], a committee member of the SPEE Monograph 4, presented the following diagnostic plot as an extension of the above. Seidle [2017] also presented FMB and Rate Transient Analysis (RTA) as an important parameter diagnostic for unconventional reserves analysis. Blasingame [2015] provides a basic interpretation of Multi-Fractured Horizontal Well flow regimes with respect to some of the more common diagnostic plots
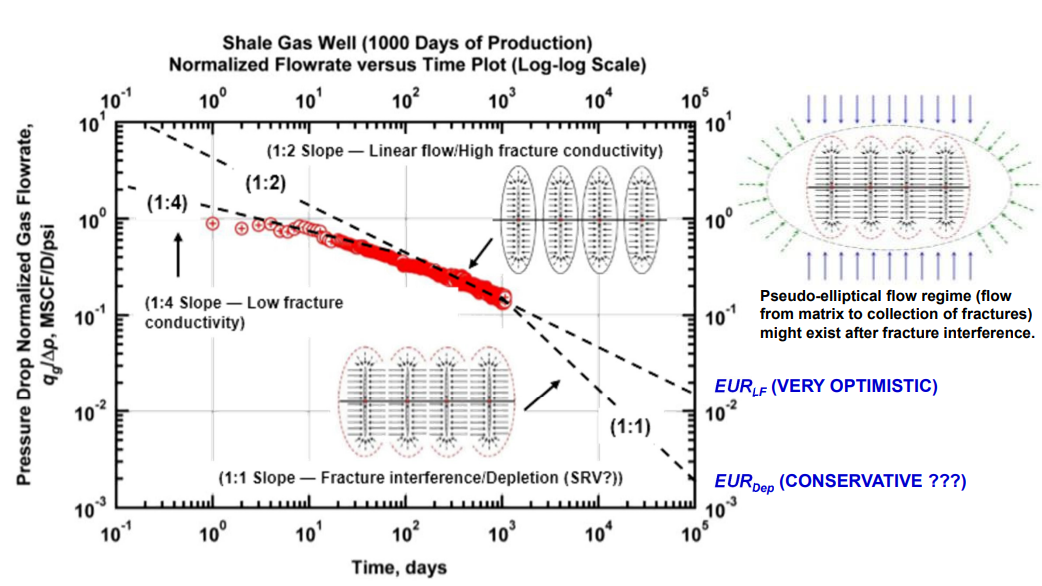
Duration/Existence of flow regimes are different for EACH PLAY and COMPLETION
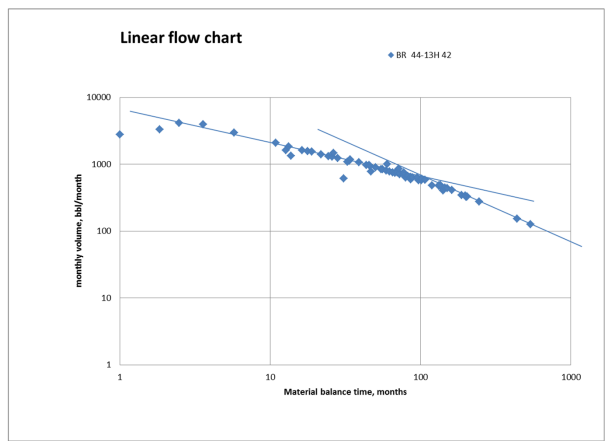
In the example below, from a Wyoming Horizontal Well 16-1H, only linear flow is observed (maybe transitional), and essentially no boundary dominated flow. For more discussion on linear flow, refer to Multi-Fractured Horizontal Well models in the FMB and Rate Transient Analysis (RTA) documentation. Predico has also developed Linear Flow Models. According to the SPEE Monograph 4, these are three (3) states to determine before applying any model.
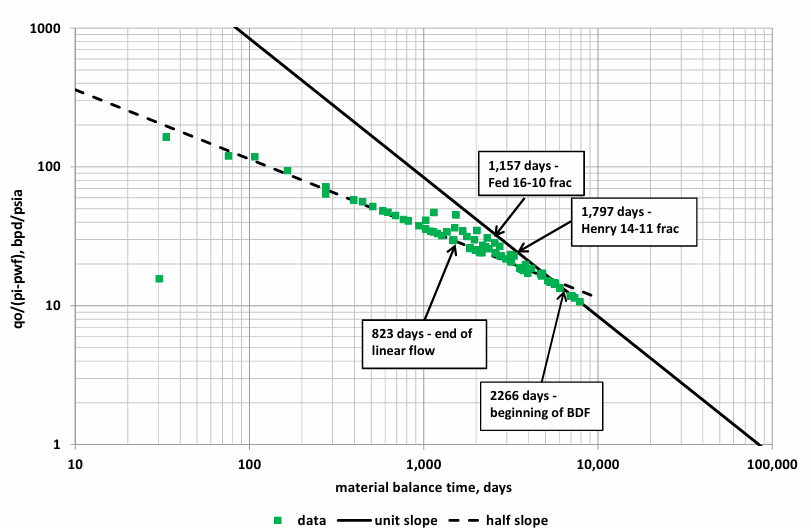
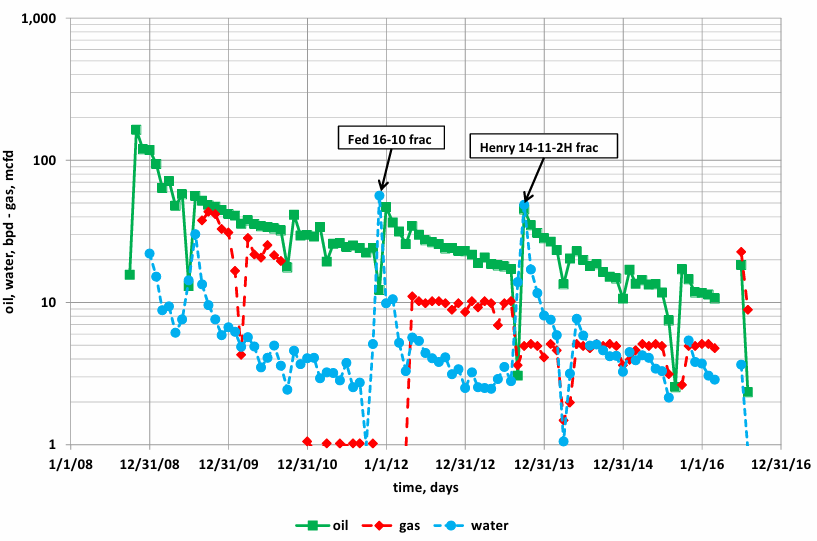
In this additional example for Wynoming Horizontal Well Thunder Bolt 1-2H, the pressure normalized rate diagnostic plot showed substantial linear flow followed by boundary dominated flow. Seidle [2017] suggested in the examples below, you could possibly determine fracture interference. That is, Fed 16-10 Frac or Henry 14-11 Frac caused a deviation in the diagnostic plot.
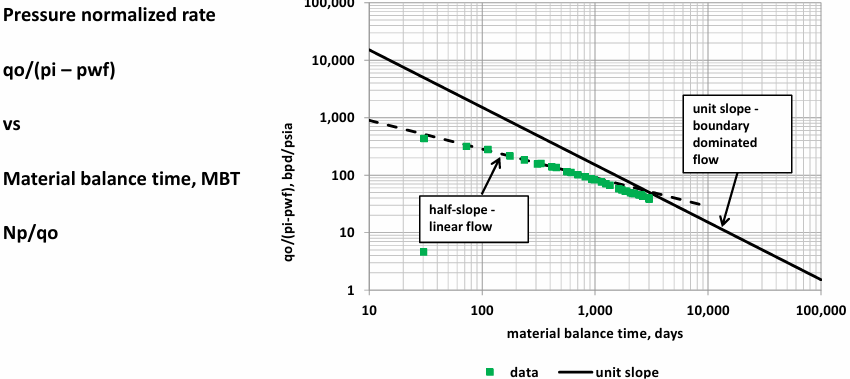
John Lee [2013] presented a similar example for a horizontal well identifying both linear and boundary dominated flow.
Ortiz [2013] presented similar example where bilinear and linear flows were identified using normalized pressure vs regular Material Balance Time. In this example, Ortiz [2013] was using Pseudo Pressure
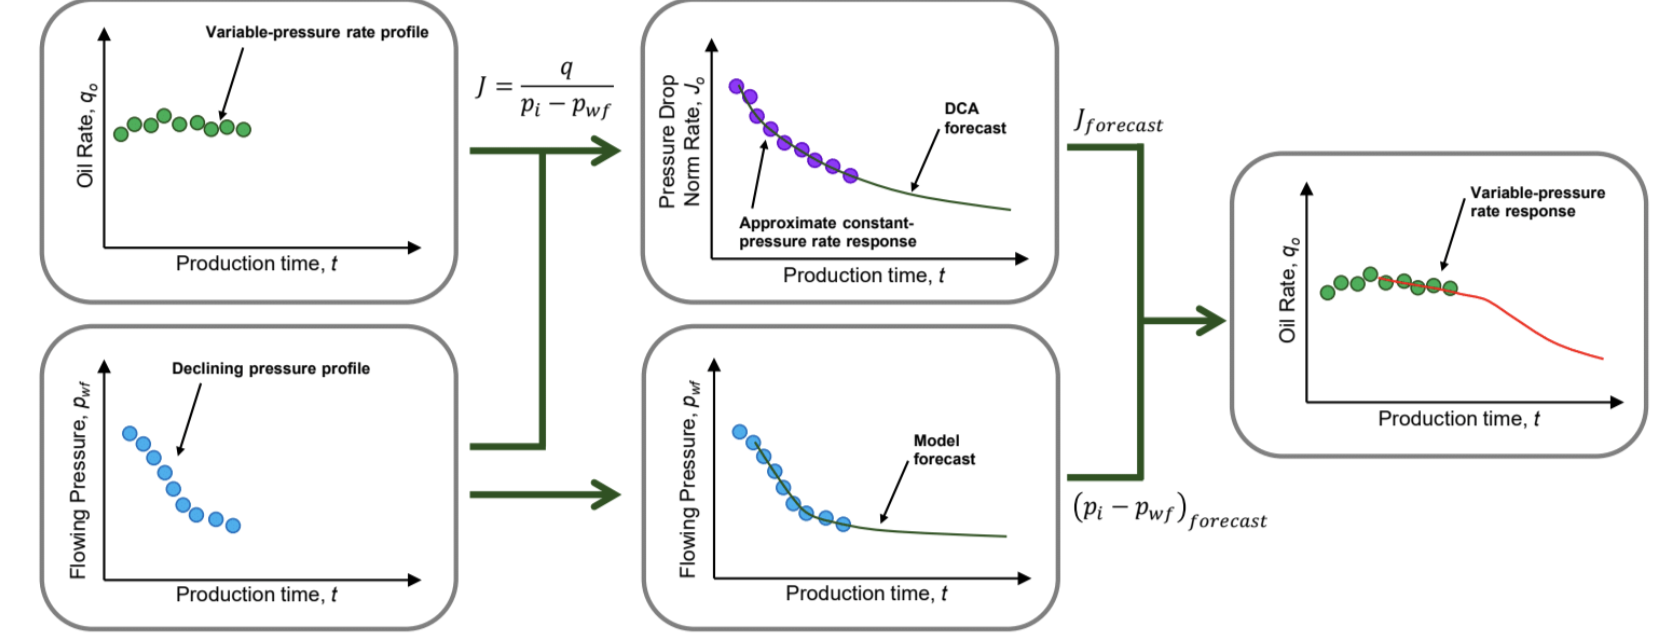
Forecasting Rates and Pressures
According to Ilk [2023], also a committee member of SPE Monograph 4, normalized rate and flowing pressure can be both forecasted to provide the “variable-pressure' response of oil rate in time.
See Also:
References:
-
Dr. Dilhan Ilk, A , “Survey on Diagnostic Based Methods for Well Performance Analysis and Production Forecasting in Unconventional Reservoir”, SPEE Denver Chapter, April 12, 2023.
-
John Seidle, “Adaptation of SPEE Monograph 4 to Wyoming Horizontal Plays“, October 12, 2017.
-
John Lee, “Are Our Proved Shale Reserves Reasonably Certain?” Ryder Scott Conference, 2013.
-
Patrick William Collins “Decline Curve Analysis for Unconventional Reservoir Systems - Variable Pressure Drop Case” Professional Studies, M.Sc. Texas A&M University, 2016.